3 Global Stocks Possibly Undervalued By Up To 48.2%

As global markets navigate mixed economic signals, including a cooling U.S. labor market and fluctuating consumer confidence, investors are keenly observing sectors that show resilience amid uncertainty. With major indices like the Nasdaq Composite and S&P 500 experiencing varied performances, identifying potentially undervalued stocks becomes crucial for those looking to capitalize on market inefficiencies. In this context, a good stock is often characterized by strong fundamentals and the ability to perform well despite broader economic challenges.
Top 10 Undervalued Stocks Based On Cash Flows
| Name | Current Price | Fair Value (Est) | Discount (Est) |
| Xianheng International Science&Technology (SHSE:605056) | CN¥15.38 | CN¥31.95 | 51.9% |
| Smart Eye (OM:SEYE) | SEK88.10 | SEK174.34 | 49.5% |
| Mao Geping Cosmetics (SEHK:1318) | HK$55.95 | HK$110.62 | 49.4% |
| Kunshan Dongwei TechnologyLtd (SHSE:688700) | CN¥74.11 | CN¥146.58 | 49.4% |
| JOST Werke (XTRA:JST) | €55.40 | €109.70 | 49.5% |
| Jerónimo Martins SGPS (ENXTLS:JMT) | €16.34 | €32.29 | 49.4% |
| Hiab Oyj (HLSE:HIAB) | €53.90 | €106.78 | 49.5% |
| GMO internet group (TSE:9449) | ¥3688.00 | ¥7352.12 | 49.8% |
| Dynavox Group (OM:DYVOX) | SEK65.70 | SEK129.95 | 49.4% |
| Anker Innovations Technology (SZSE:300866) | CN¥106.23 | CN¥210.53 | 49.5% |
Let’s take a closer look at a couple of our picks from the screened companies.
Overview: X-FAB Silicon Foundries SE is engaged in the development, production, and sale of analog/mixed-signal ICs, micro-electro-mechanical systems, and silicon photonics products across various sectors including automotive and medical, with a market capitalization of approximately €1.13 billion.
Operations: The company’s revenue primarily comes from its CMOS and MEMS operations, totaling $861.69 million.
Estimated Discount To Fair Value: 17.8%
X-FAB Silicon Foundries is trading at €8.67, below its estimated future cash flow value of €10.55, suggesting it may be undervalued based on cash flows. Despite a volatile share price and reduced profit margins (2.2% from 6.3% last year), earnings are projected to grow significantly at 38.81% annually, outpacing the French market’s growth rate of 12.4%. Recent earnings showed lower revenue and net income compared to last year, with first-quarter sales at US$195.55 million.
Overview: Avanza Bank Holding AB (publ) operates in Sweden, offering savings, pension, and mortgage products through its subsidiaries, with a market cap of SEK62.41 billion.
Operations: The company generates revenue of SEK5.08 billion from its commercial operations segment.
Estimated Discount To Fair Value: 24%
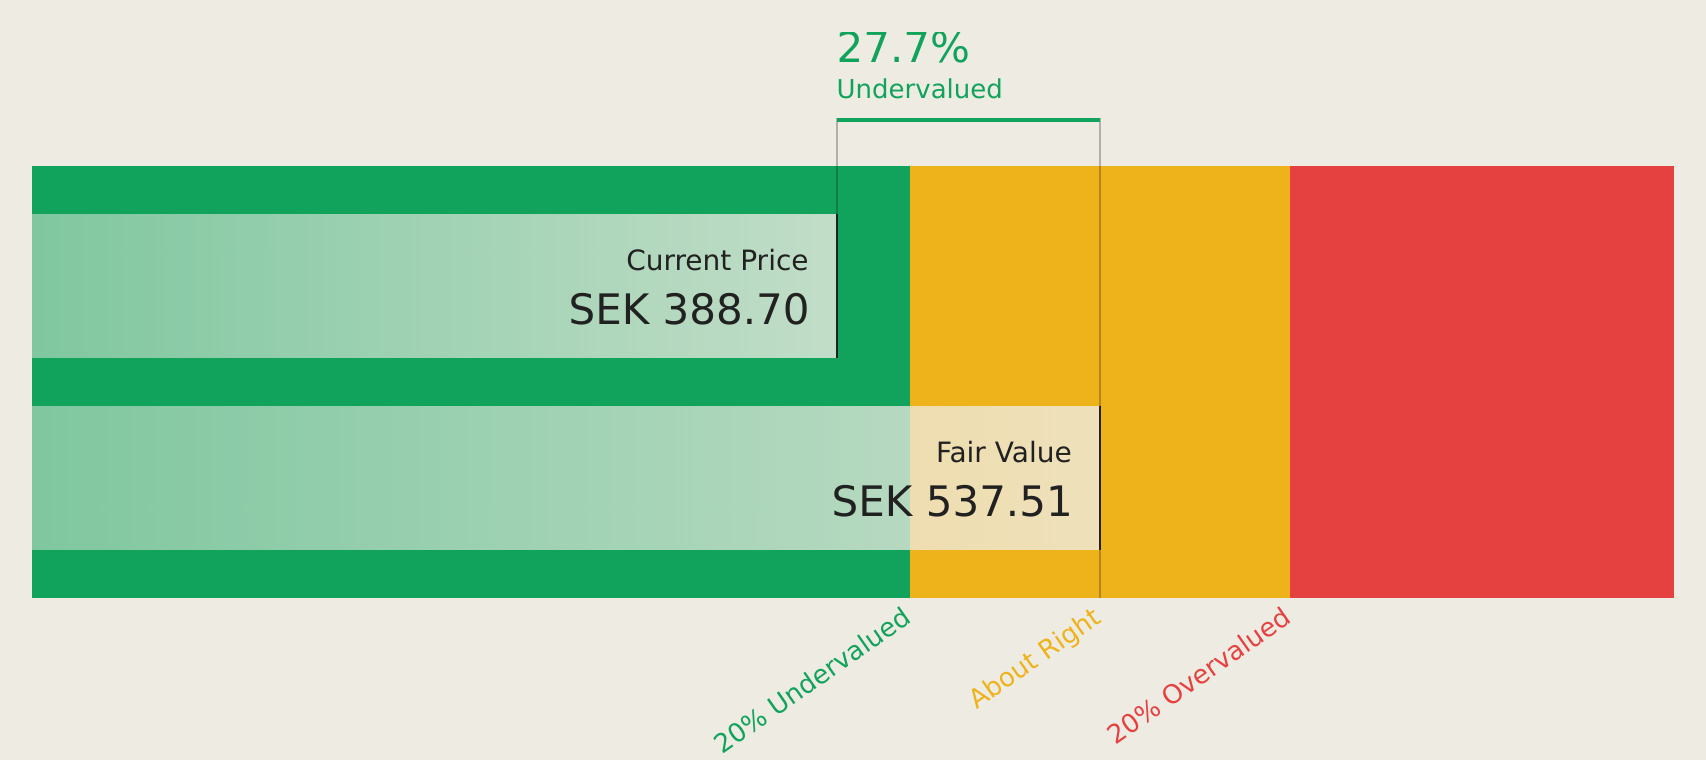
Avanza Bank Holding is trading at SEK 395.4, well below its estimated future cash flow value of SEK 519.98, indicating potential undervaluation based on cash flows. The company reported a net income increase to SEK 754 million in Q1 2026, with earnings per share also rising slightly. Despite an unstable dividend history, Avanza’s earnings are forecast to grow at 8.94% annually, surpassing the Swedish market’s growth rate of -0.3%.
Overview: COVER Corporation operates a VTubers distribution platform in Japan for video and music content, with a market cap of ¥106.09 billion.
Operations: Revenue segments for TSE:5253 include the distribution of videos and music through a VTubers platform in Japan.
Estimated Discount To Fair Value: 48.2%
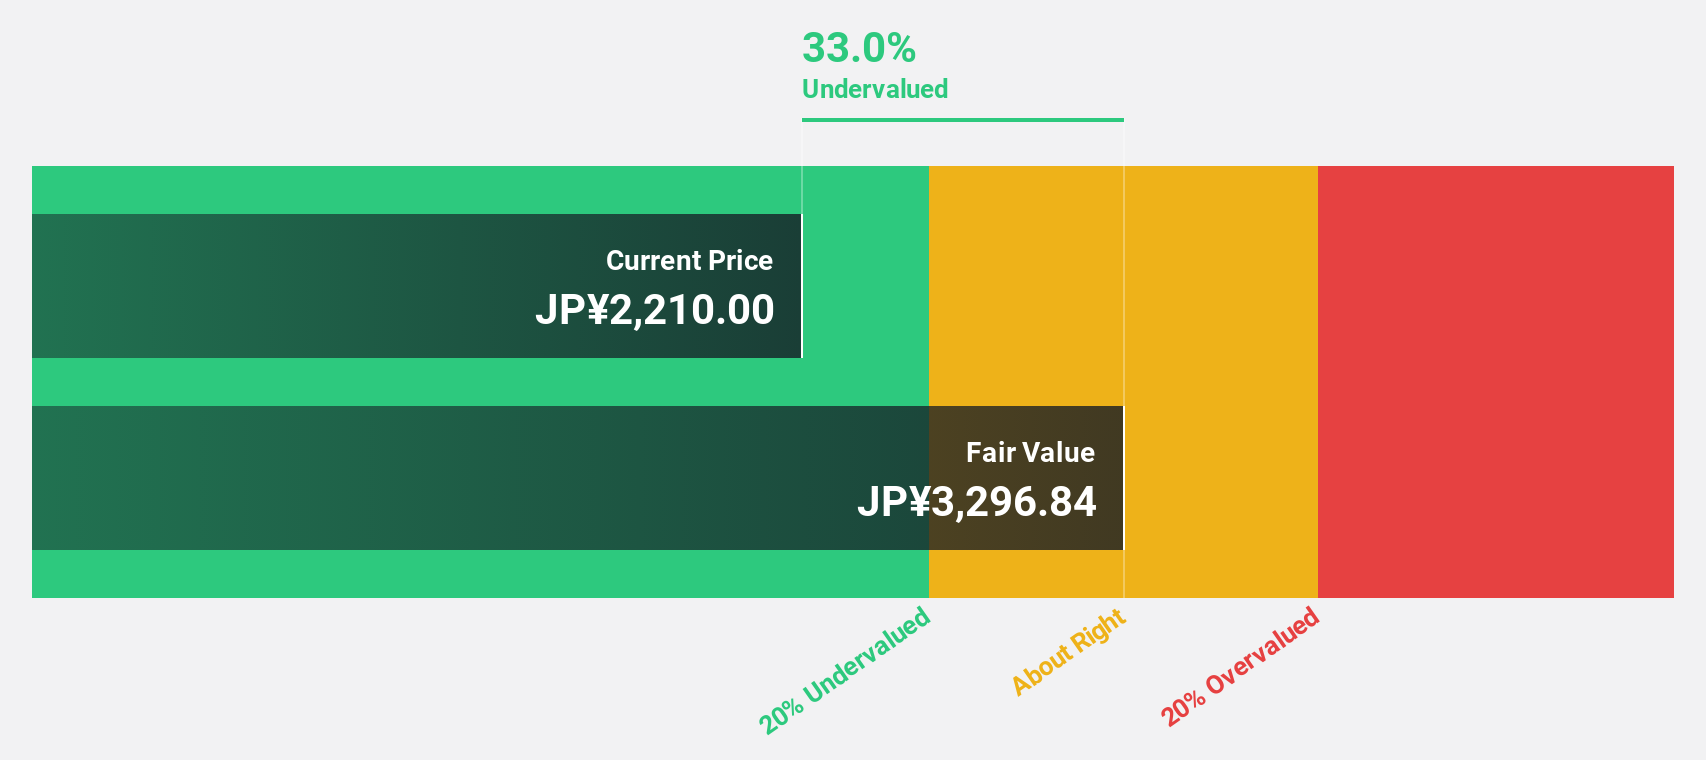
COVER Corporation is trading at ¥1,625, significantly below its estimated future cash flow value of ¥3,138.51, suggesting it may be undervalued. Earnings are forecast to grow 26.8% annually, outpacing the JP market’s 10.1%. Recent share buybacks totaling ¥2,999.86 million could enhance shareholder value but profit margins have decreased from 12.8% to 6.1%, and large one-off items affect earnings quality despite high projected revenue growth of 10.2%.
Key Takeaways
Ready To Venture Into Other Investment Styles?
This article by Simply Wall St is general in nature. We provide commentary based on historical data
and analyst forecasts only using an unbiased methodology and our articles are not intended to be financial advice.
It does not constitute a recommendation to buy or sell any stock, and does not take account of your objectives, or your
financial situation. We aim to bring you long-term focused analysis driven by fundamental data.
Note that our analysis may not factor in the latest price-sensitive company announcements or qualitative material.
Simply Wall St has no position in any stocks mentioned.
New: Manage All Your Stock Portfolios in One Place
We’ve created the ultimate portfolio companion for stock investors, and it’s free.
• Connect an unlimited number of Portfolios and see your total in one currency
• Be alerted to new Warning Signs or Risks via email or mobile
• Track the Fair Value of your stocks
Have feedback on this article? Concerned about the content? Get in touch with us directly. Alternatively, email editorial-team@simplywallst.com