Navigator Global Investments And 2 More ASX Stocks That May Be Trading Below Estimated Value

With the ASX 200 futures pointing to a significant advance and local factors contributing positively, the Australian market is showing signs of resilience amid global economic developments. In this environment, identifying undervalued stocks can be particularly rewarding, as these equities may offer potential value gains when market conditions stabilize or improve.
Top 10 Undervalued Stocks Based On Cash Flows In Australia
| Name | Current Price | Fair Value (Est) | Discount (Est) |
| Superloop (ASX:SLC) | A$3.12 | A$5.61 | 44.3% |
| NRW Holdings (ASX:NWH) | A$6.95 | A$13.79 | 49.6% |
| NobleOak Life (ASX:NOL) | A$1.11 | A$1.96 | 43.3% |
| Navigator Global Investments (ASX:NGI) | A$2.39 | A$4.67 | 48.8% |
| Magellan Financial Group (ASX:MFG) | A$9.79 | A$17.12 | 42.8% |
| Lycopodium (ASX:LYL) | A$17.80 | A$31.08 | 42.7% |
| Frontier Digital Ventures (ASX:FDV) | A$0.325 | A$0.62 | 47.9% |
| Betr Entertainment (ASX:BBT) | A$0.165 | A$0.30 | 45.9% |
| Aurelia Metals (ASX:AMI) | A$0.315 | A$0.58 | 46% |
| Aroa Biosurgery (ASX:ARX) | A$0.58 | A$1.04 | 44.4% |
We’ll examine a selection from our screener results.
Overview: Navigator Global Investments, operating as HFA Holdings Limited, is a fund management company based in Australia with a market cap of A$1.46 billion.
Operations: The company generates revenue primarily from its Lighthouse segment, amounting to $150.39 million.
Estimated Discount To Fair Value: 48.8%
Navigator Global Investments appears undervalued based on cash flow analysis, trading at A$2.39 against a future cash flow value estimate of A$4.67, suggesting it is priced below its intrinsic value by over 20%. Despite recent shareholder dilution from a follow-on equity offering of A$144.98 million, the company anticipates significant earnings growth at 38.5% annually, outpacing the broader Australian market’s expected growth rate of 11.3%.
Overview: Pinnacle Investment Management Group Limited operates as an investment management company in Australia with a market cap of A$3.65 billion.
Operations: The company generates revenue from its Funds Management Operations, amounting to A$83.90 million.
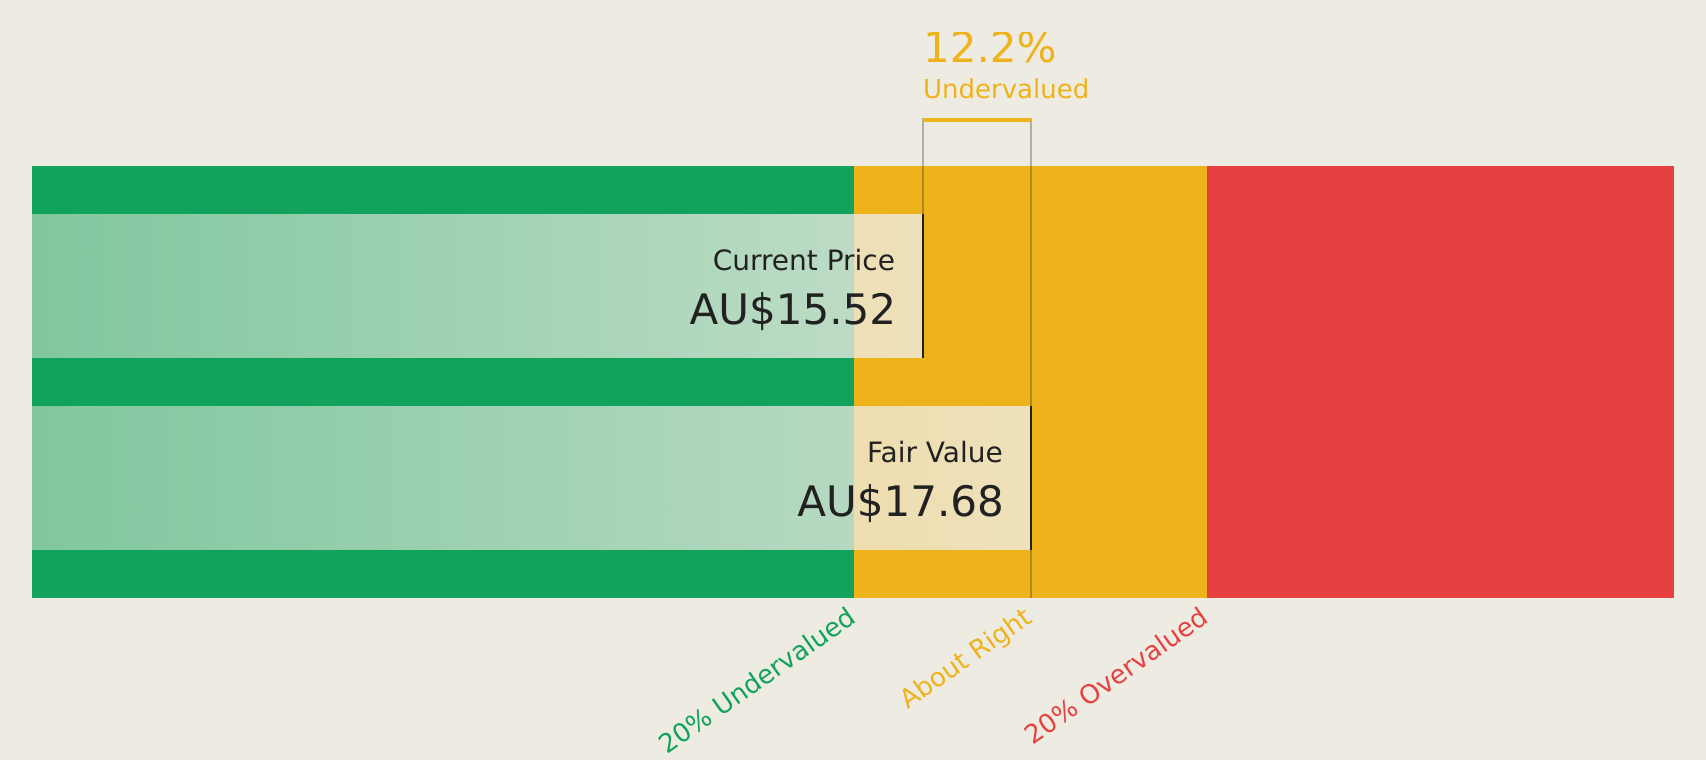
Estimated Discount To Fair Value: 12.2%
Pinnacle Investment Management Group is trading at A$15.52, below its estimated future cash flow value of A$17.68, indicating undervaluation. However, the dividend yield of 3.61% isn’t well covered by earnings or free cash flows. Despite lower profit margins than last year, revenue and earnings are forecast to grow significantly at 30.5% and 21.1% per year respectively, outpacing the Australian market’s growth expectations and supporting a high future return on equity of 25.4%.
Overview: SHAPE Australia Corporation Limited operates in the construction, fitout, and refurbishment of commercial properties across Australia, with a market cap of A$550.37 million.
Operations: The company’s revenue is primarily derived from its heavy construction segment, which generated A$1.03 billion.
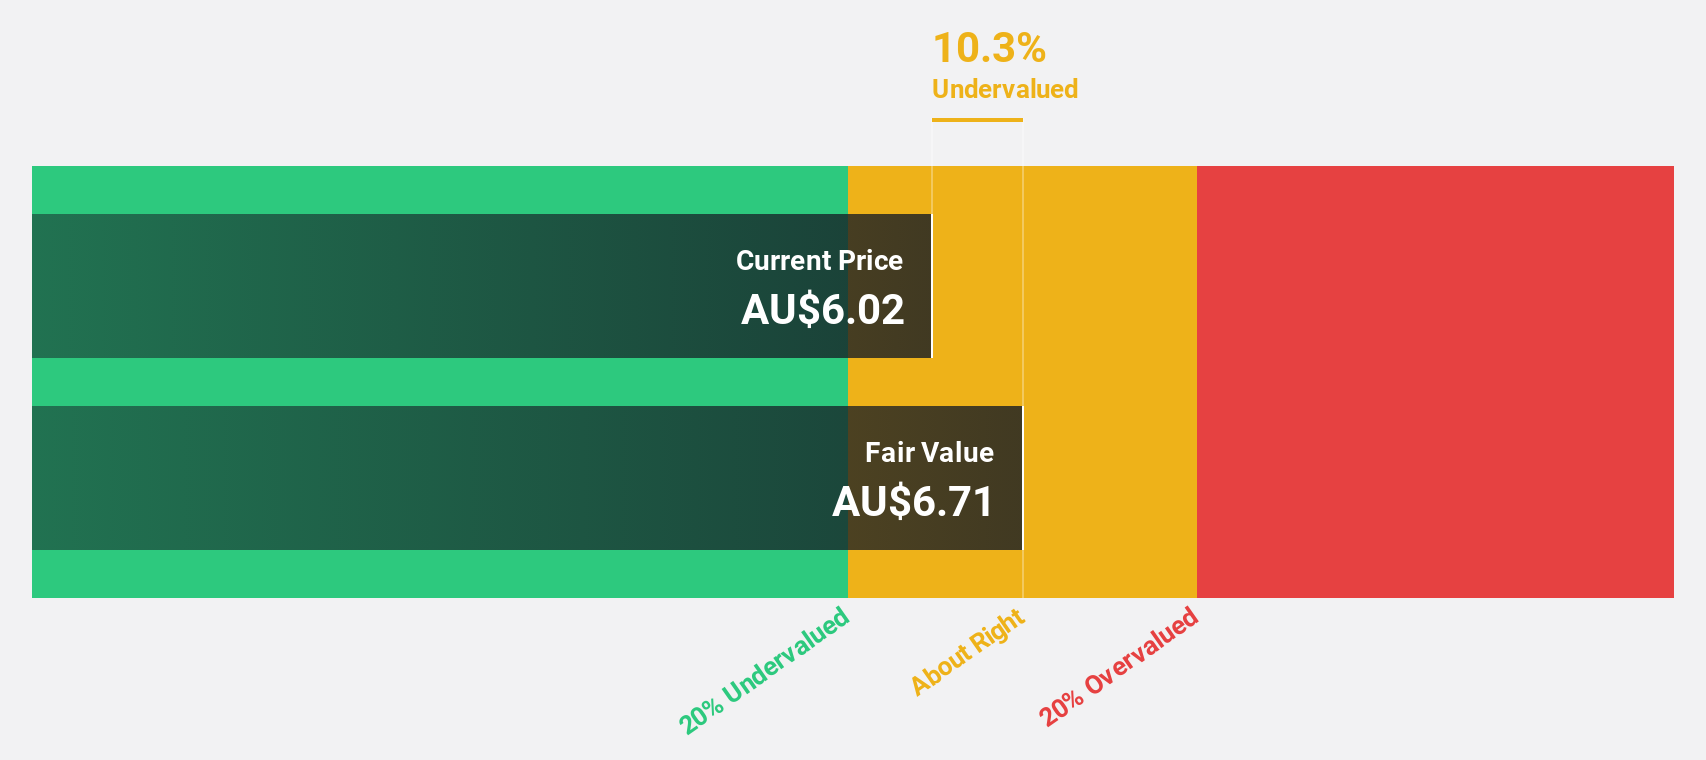
Estimated Discount To Fair Value: 25.7%
SHAPE Australia, trading at A$6.6, is undervalued with respect to its future cash flow value of A$8.88 and trades 25.7% below fair value estimates. Earnings grew by 43.3% last year and are expected to grow at 12.64% annually, surpassing the Australian market’s growth rate of 11.3%. Revenue is projected to increase by 9.8% per year, coupled with a very high forecasted return on equity of 63.2%, although dividend sustainability remains unstable amidst acquisition discussions.
Seize The Opportunity
Want To Explore Some Alternatives?
This article by Simply Wall St is general in nature. We provide commentary based on historical data
and analyst forecasts only using an unbiased methodology and our articles are not intended to be financial advice.
It does not constitute a recommendation to buy or sell any stock, and does not take account of your objectives, or your
financial situation. We aim to bring you long-term focused analysis driven by fundamental data.
Note that our analysis may not factor in the latest price-sensitive company announcements or qualitative material.
Simply Wall St has no position in any stocks mentioned.
New: Manage All Your Stock Portfolios in One Place
We’ve created the ultimate portfolio companion for stock investors, and it’s free.
• Connect an unlimited number of Portfolios and see your total in one currency
• Be alerted to new Warning Signs or Risks via email or mobile
• Track the Fair Value of your stocks
Have feedback on this article? Concerned about the content? Get in touch with us directly. Alternatively, email editorial-team@simplywallst.com