SPX Expected Move, Gold Skew, AVGO Earnings: What the Option…
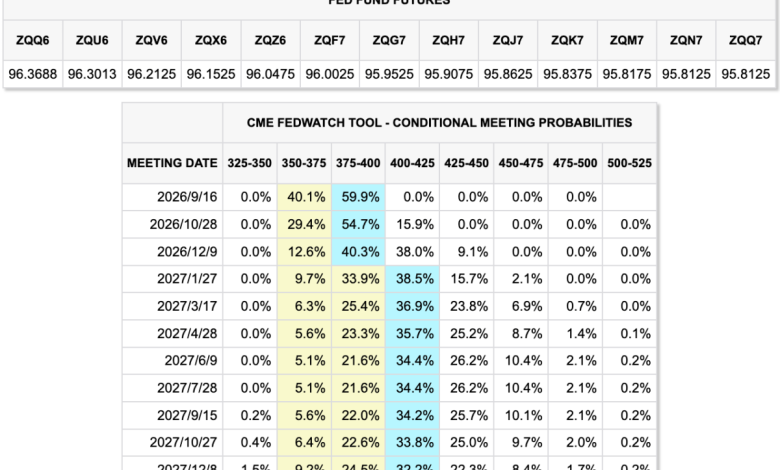
– Warsh’s hawkish Jackson Hole speech pushed September hike odds to 60% and 2Y yields to 4.35% — yet equity vol (14.5), bond vol (11.45), and FX vol (6.23) all sit at multi-week lows. The mismatch between policy risk and vol pricing is the trade.
– CPI (Sep 11) → FOMC (Sep 16, ±1.11% EM) → BOJ (Sep 18) creates a three-event cluster. Cumulative moves can compound well beyond any single print.
September hike probability at 59.9%
And yet, looking at the cross-asset vol surface, the options market has barely responded. – EQ vol 14.5 · Bond vol 11.45 · FX vol 6.23 — all multi-week lows. Oil vol is elevated from Iran/Hormuz risk residual. Trade policy uncertainty spiked from US/Canada spat as fresh catalyst. Overall, the asymmetry is clear: vol is cheap, the catalyst is live, and September’s calendar is dense enough to ignite the move.
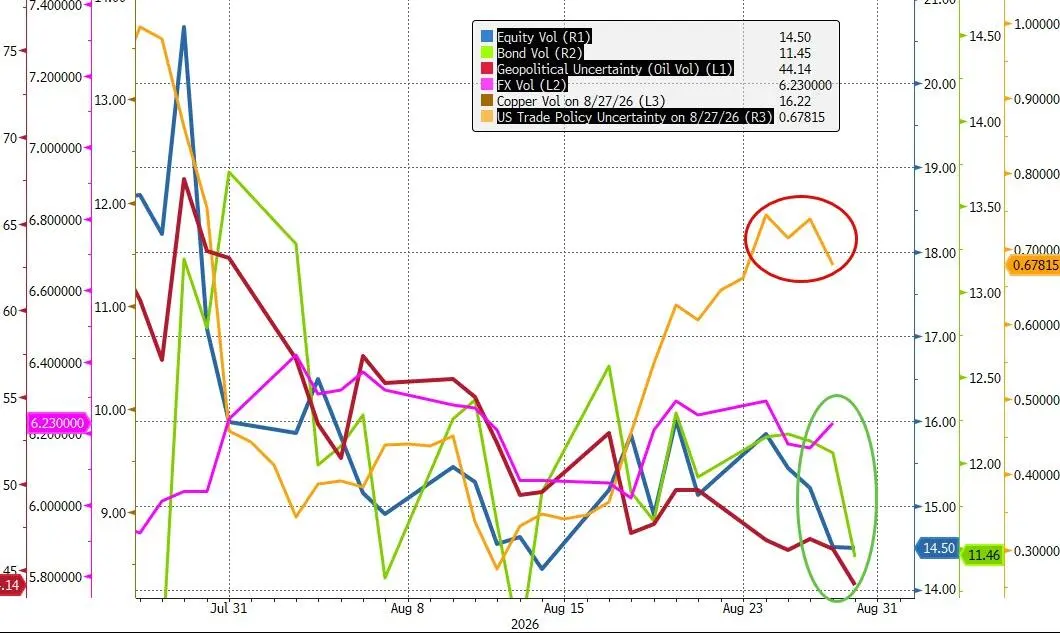
Equity, bond, and FX vol all at multi-week lows
SPX IV Skew: The Market Isn’t Afraid Yet
The SPX 1-month 25-delta put-call risk reversal remains near the lower end of its historical range. Implied vol is sitting at the flatter end of the recent distribution, and skew has not widened meaningfully.
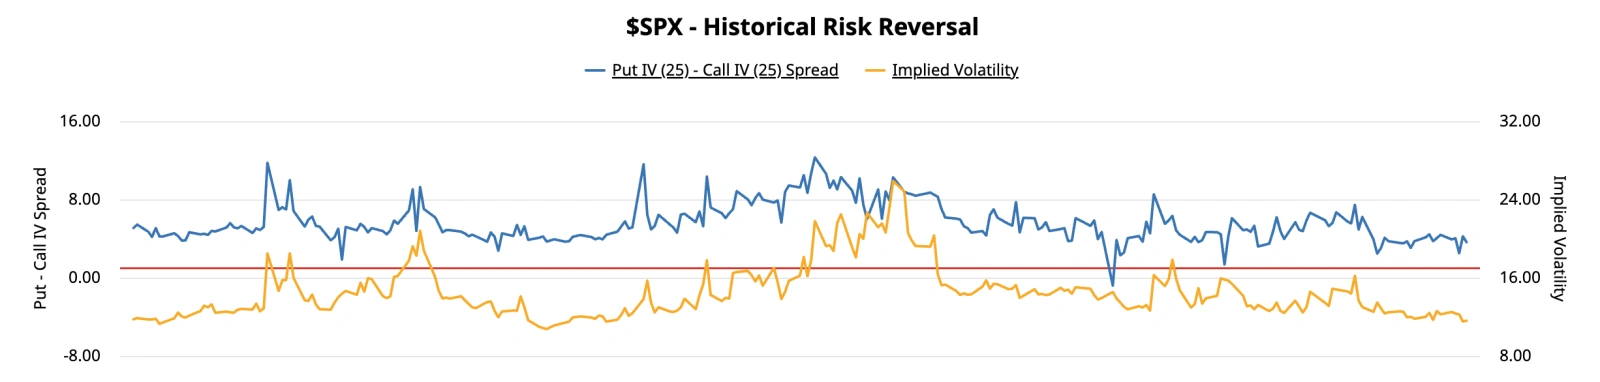
SPX skew near historical lows
Tail protection is cheap at current skew levels. With PCE at 3.7% YoY and 4.1% annualized over six months, 54% of the PCE basket still running above 3%, and a Fed that just described financial conditions as “as loose as we’ve ever been” — the risk/reward of owning puts or reducing naked long gamma is compelling heading into a September loaded with binary catalysts.
Goldman’s single-name data adds nuance on vol ownership: the market is pricing lower 3-month forward IV relative to realized — large negative vol premium. One-third of SPX has 3-month ATM implieds in the sub-5th percentile on a 6-month lookback. Goldman calls single-stock vol ownership attractive into Labor Day thinning.
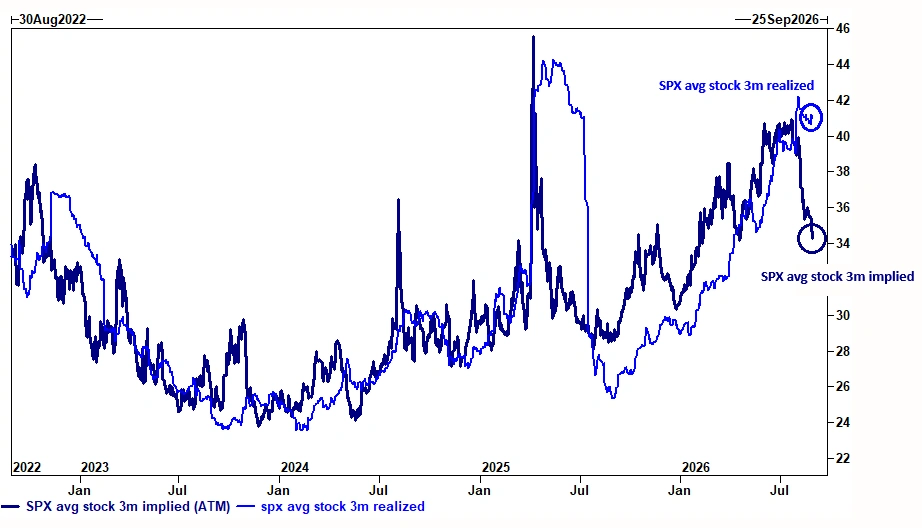
Single-stock implied vol now largely below realized
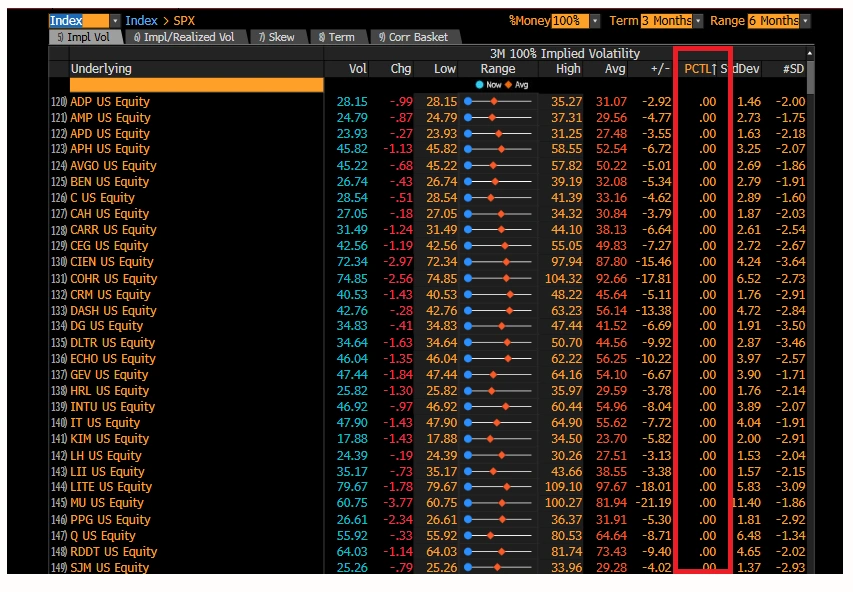
One-third of SPX stocks showing implieds in the sub-5th percentile — vol ownership looks attractive
SPX Expected Move – September
Every data print from here through September is now a de facto Fed meeting.
The FOMC on September 16 carries the largest single-event premium at ±1.11% — and this was priced before Friday’s speech. With September hike odds now at 60%, the market may be under-pricing FOMC optionality. The sequential shock potential across CPI (Sep 11) → FOMC (Sep 16) → BOJ (Sep 18) creates a three-event cluster where cumulative moves can compound well beyond any individual isolated EM.
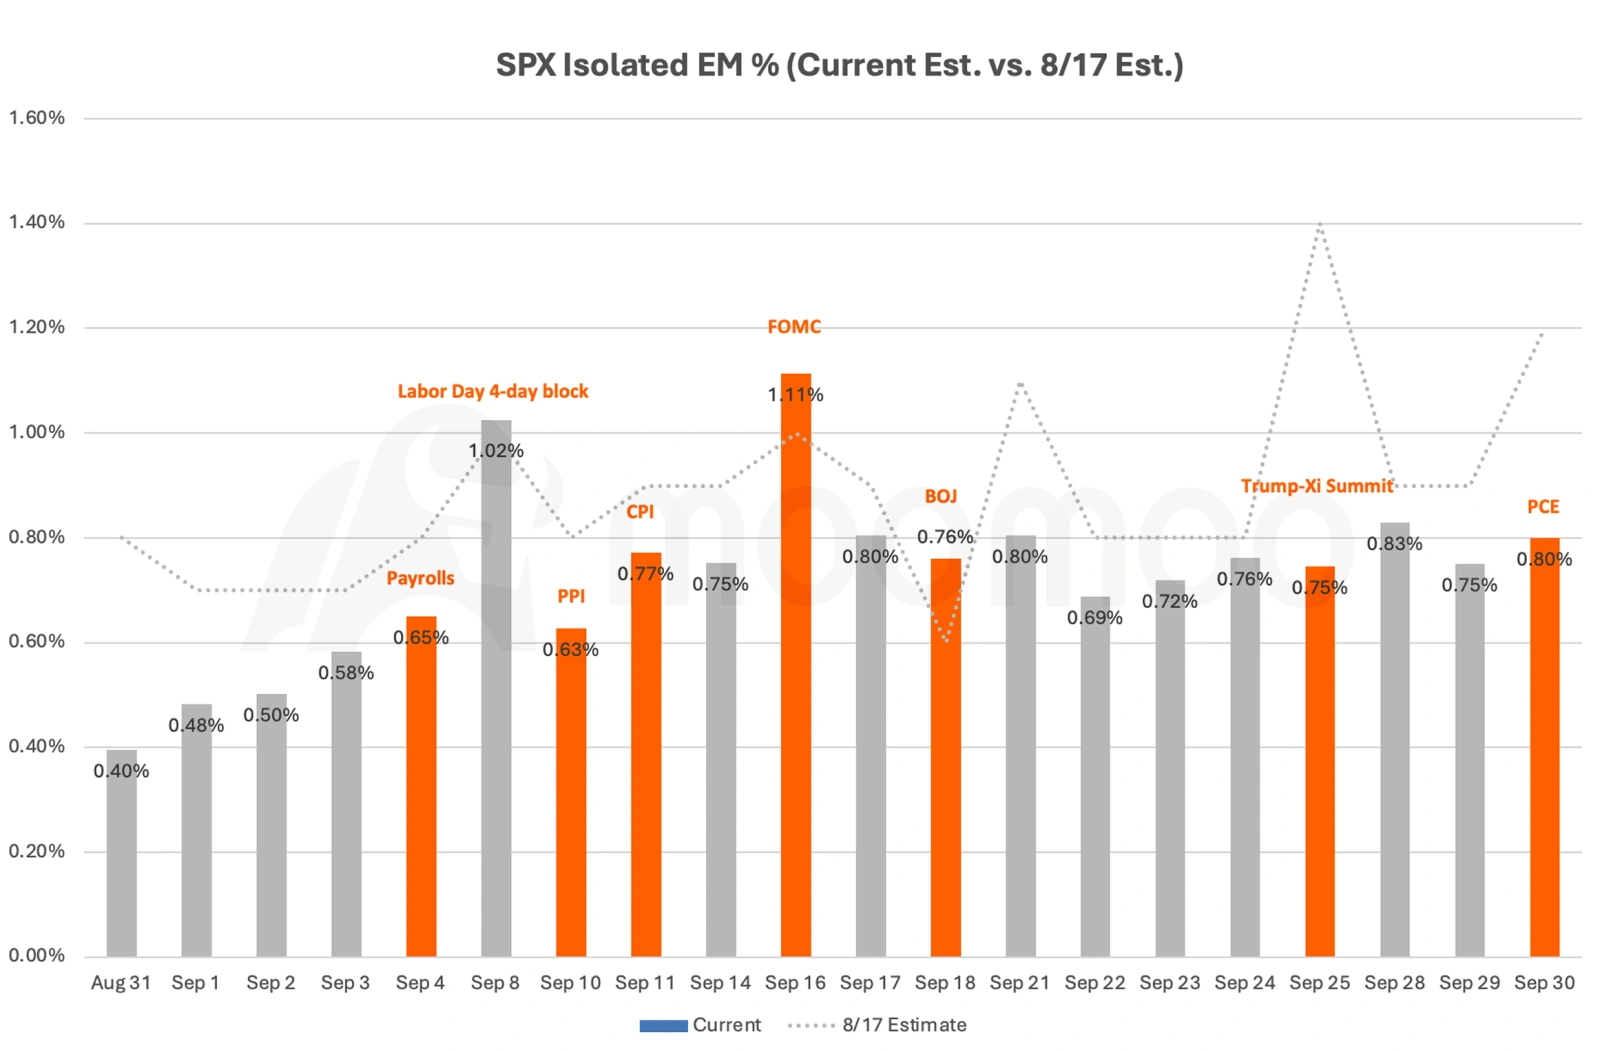
FOMC (±1.11%) leads September’s event risk
Gold (GLD) Options: Debasement vs. Rate Hike
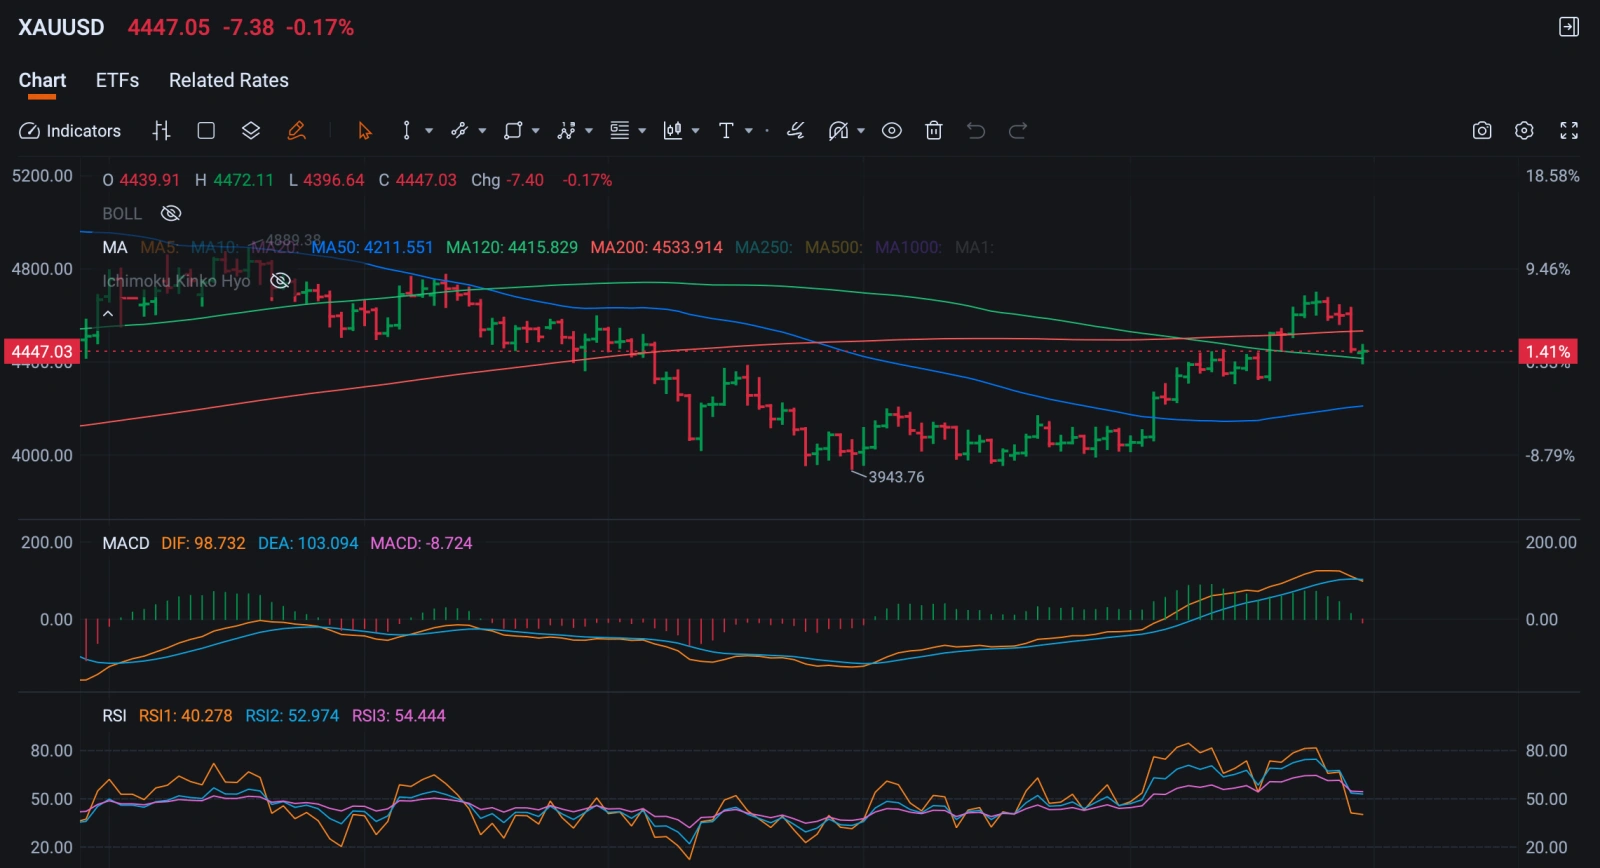
Gold breaks its 200-day moving average — tactical headwind as real yields rise
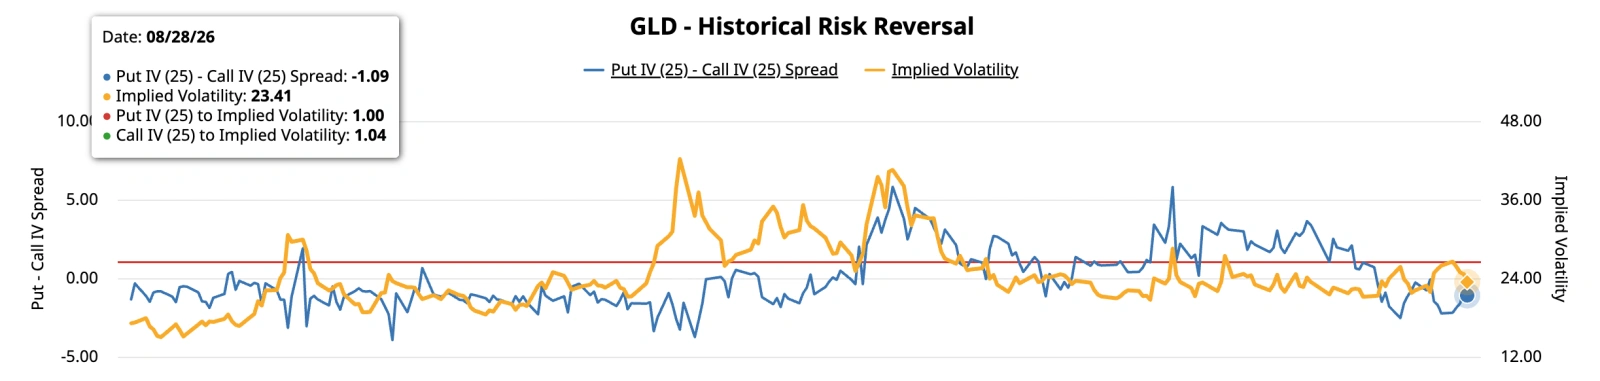
GLD risk reversal at -1.09 — calls more expensive than puts, debasement bid intact
Short-term headwind: Warsh restored inflation-fighting credibility. Real yields rising + stronger dollar = gold suffers, as Friday demonstrated. 200DMA break is a technical negative.
Longer-term structural bid: $40 trillion debt load, fiscal uncertainty, geopolitical risk (Oil Vol 44.14), spiking trade policy uncertainty — all support gold as a long-duration hedge. Gold and precious-metals funds inflows hit a 6-month high of $4.21 billion this week despite Friday’s selloff. Institutional positioning is not capitulating.
The market is not abandoning the upside case. It is pricing gold as a two-tailed event — tactically vulnerable to rate-driven drawdowns, but with persistent call demand on any reversal of hawkish rhetoric or fiscal deterioration.
Broadcom (AVGO) Earnings: ±7.79% Into the Eye of the AI Storm
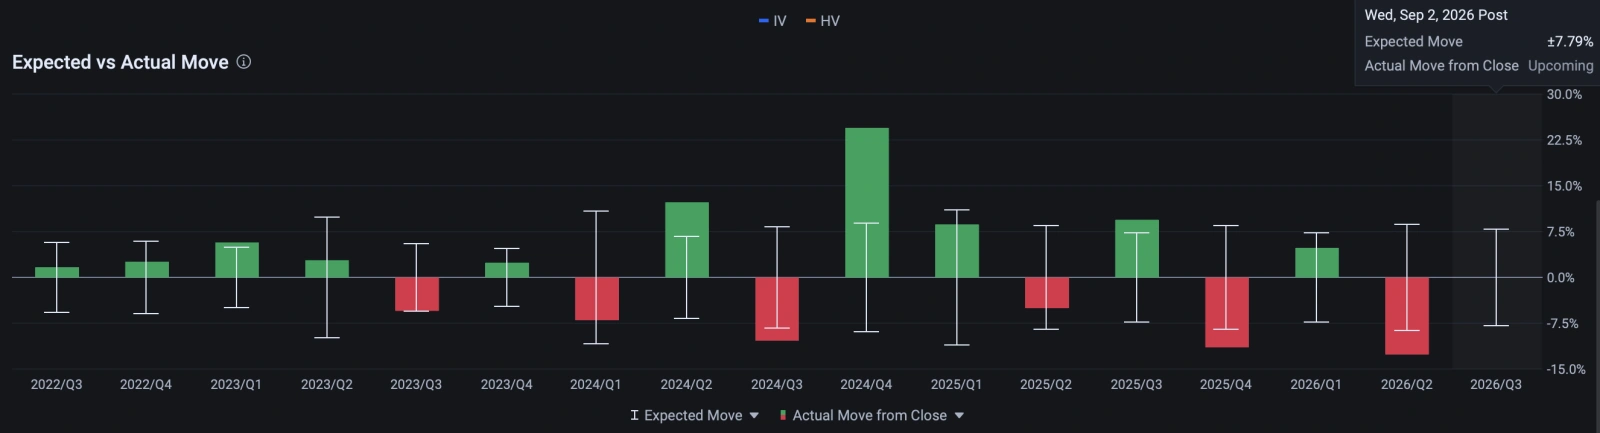
AVGO’s current ±7.79% EM in line with historical average
Potential strategies of defined-risk directional structures (put spread or call spread) over premium-buying straddles. The 8.52% average IV crush makes long-vol strategies a difficult carry — you need to be right on both direction AND magnitude to overcome it. The current ±7.79% expected move is broadly in line with historical average (abs avg 8.17%) — options are fairly priced, not cheap.
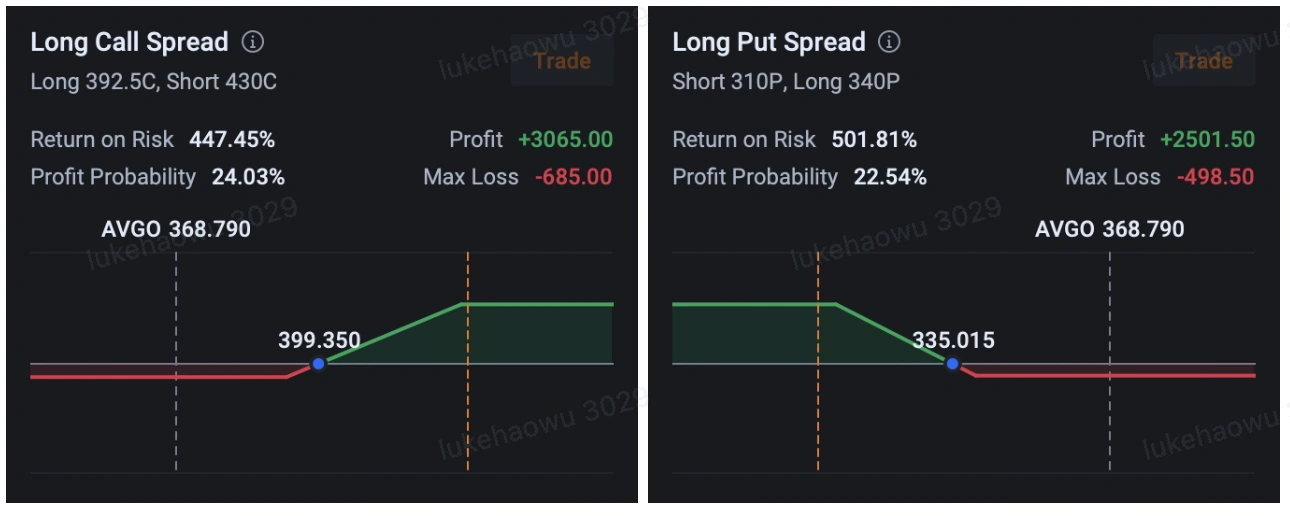
*Images are for illustrative purposes only and do not constitute investment advice.