Spot Gold, WTI Crude Oil Futures

This article summarizes the latest views of analysts from Economies.com today, covering multiple instruments including spot gold and WTI crude oil futures!
Brent crude oil futures broke through the bullish correction trendline.
In the latest round of intraday trading, Brent crude oil futures prices fell, with downward pressure reflected in their drop below the 50-day moving average, resulting in a short-term break above the bullish correction trendline and exacerbating downward price pressures. On the other hand, we observed that after reaching oversold levels, the Relative Strength Index (RSI) showed positive overlapping signals, which may help reduce losses over the coming period.
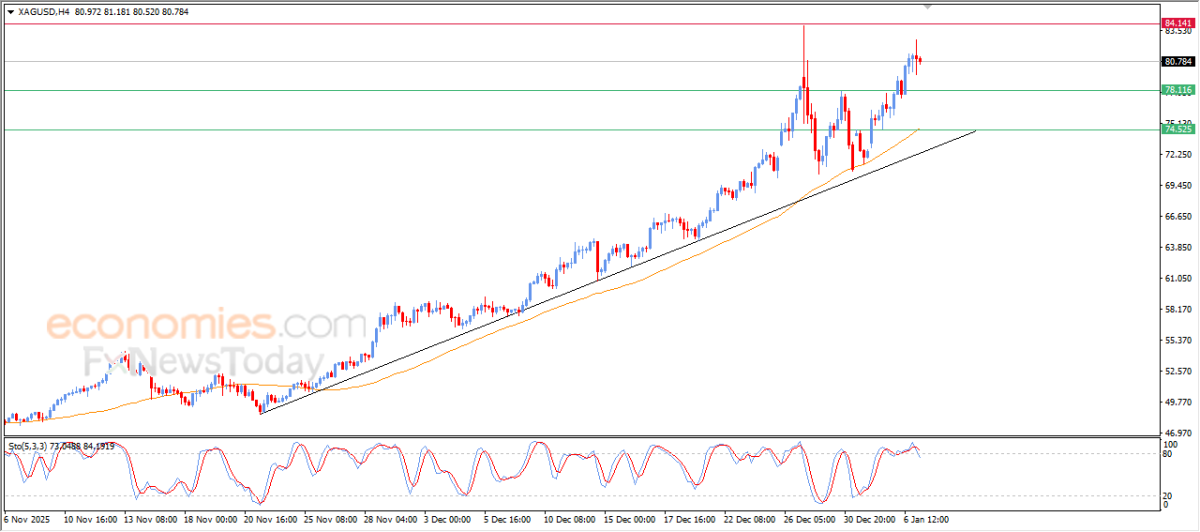
International spot silver prices continued to rise.
International spot silver experienced fluctuations in the most recent intraday trading session, attempting to consolidate prior gains while trying to shed apparent overbought conditions on the RSI, especially in the context of emerging negative signals, to accumulate positive momentum for a resumption of upward movement in the short term. With silver prices remaining above the 50-day moving average, this further reinforces the strength and dominance of the primary uptrend in the short term, with trading patterns aligning with the support trendline of this trend.
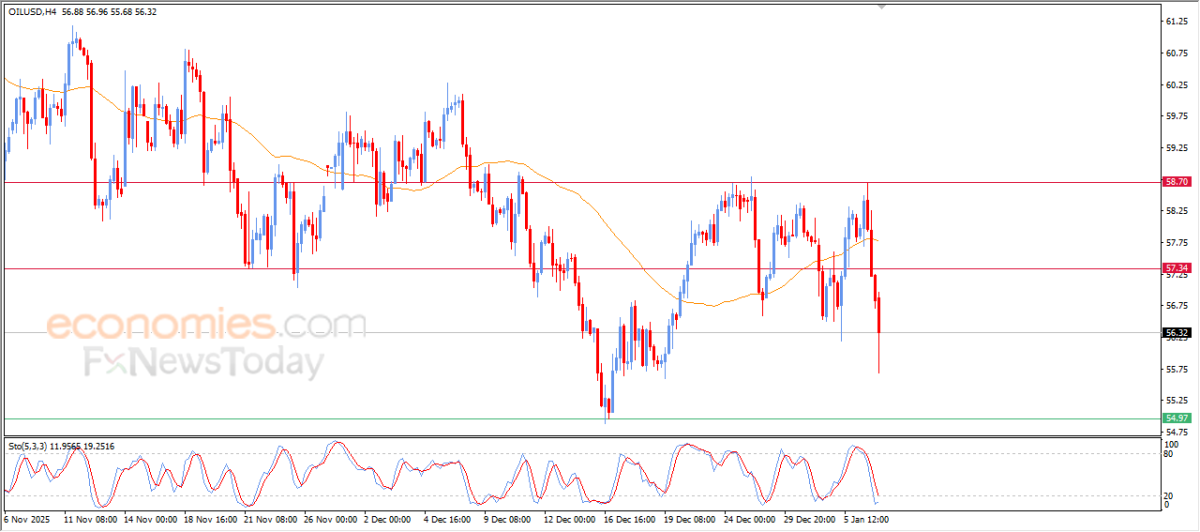
WTI crude oil futures plummeted significantly.
 WTI crude oil futures declined sharply in recent intraday trading, pressured by a drop below the EMA50, indicating weak momentum, and currently imposing clear restrictions on any bullish rebound attempts. Despite reaching oversold levels, the RSI also issued negative signals, suggesting that selling pressure remains dominant under the primary bearish trend in the short term, signaling potential threats to future recovery attempts.
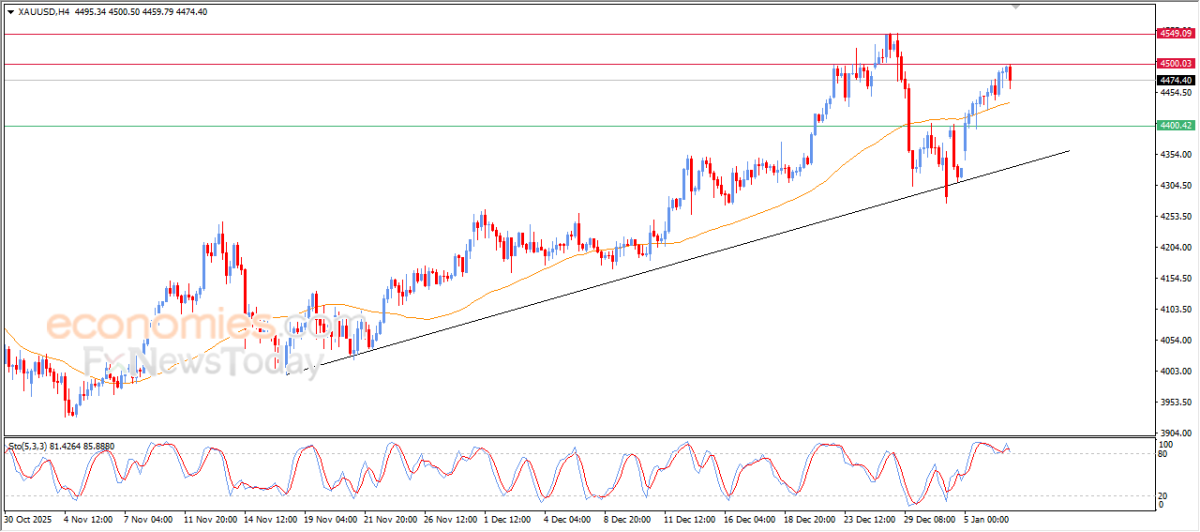
International spot gold was influenced by target resistance levels.
International spot gold prices fell during the latest intraday trading session, affected by the steady influence of the major resistance level at $4,500, which was the target level anticipated in our previous analysis. Gold entered a correction phase, attempting to regain upward momentum. In the short term, prices are operating under the dominance of the primary uptrend, trading along the support line of this trend and remaining above the EMA50, providing key dynamic support. However, negative overlapping signals have begun to appear on the RSI, indicating the formation of negative divergence, which could trigger a corrective bearish rebound within the day.