Has S&P Global (SPGI) Fallen Far Enough To Look Cheap?
S&P Global has dropped about 18.4% year to date, yet its valuation checks point to a stock that screens as fairly valued on an intrinsic basis while still looking rich on market multiples. That split, combined with fresh portfolio moves in data and energy analytics, puts the focus squarely on what investors are really paying for in S&P Global shares.
- The year to date decline of 18.4% leaves the stock trading well below recent highs, which may change how investors judge the current price tag.
- Recent moves such as the datacenterHawk acquisition and the divestiture of the upstream energy software portfolio can support the long term data and analytics story, while execution risk around integrating new assets and focusing the portfolio may weigh on what investors are willing to pay.
- The value checks are mixed, with a 3 out of 6 score, so S&P Global does not screen as a clear bargain or as clearly overpriced on the wider set of metrics.
The stock’s next move may depend on whether S&P Global’s current share price already reflects its intrinsic value estimate from the Excess Returns model, or if investors are paying a premium that recent performance does not support.
Compare S&P Global’s mixed valuation and recent portfolio reshuffle with data focused peers by scanning the pre vetted 89 AI infrastructure stocks, which could also be leveraged to the AI buildout story.
Is S&P Global Fairly Priced on Excess Returns?
The Excess Returns model values S&P Global based on how much profit it is expected to earn above its cost of equity over time. For this stock, the framework uses a Book Value of $106.86 per share and a Stable EPS of $21.36 per share, both grounded in estimates from five analysts. With an Average Return on Equity of 19.51% and a Cost of Equity of $8.89 per share, the model arrives at an Excess Return of $12.46 per share, supported by a Stable Book Value projection of $109.48 per share.
Those inputs translate to an intrinsic value estimate of $391 per share, which sits close to the current market price and points to S&P Global trading around its calculated worth. The completed acquisition of datacenterHawk adds more data center and infrastructure insight to the platform. Even with that addition, the model suggests the stock is only modestly rich rather than clearly cheap or stretched. The Excess Returns workup indicates S&P Global screens as roughly fairly valued at current levels.
S&P Global is fairly valued according to our Excess Returns, but this can change at a moment’s notice. Track the value in your watchlist or portfolio and be alerted on when to act.
Does S&P Global Look Pricey on Earnings?
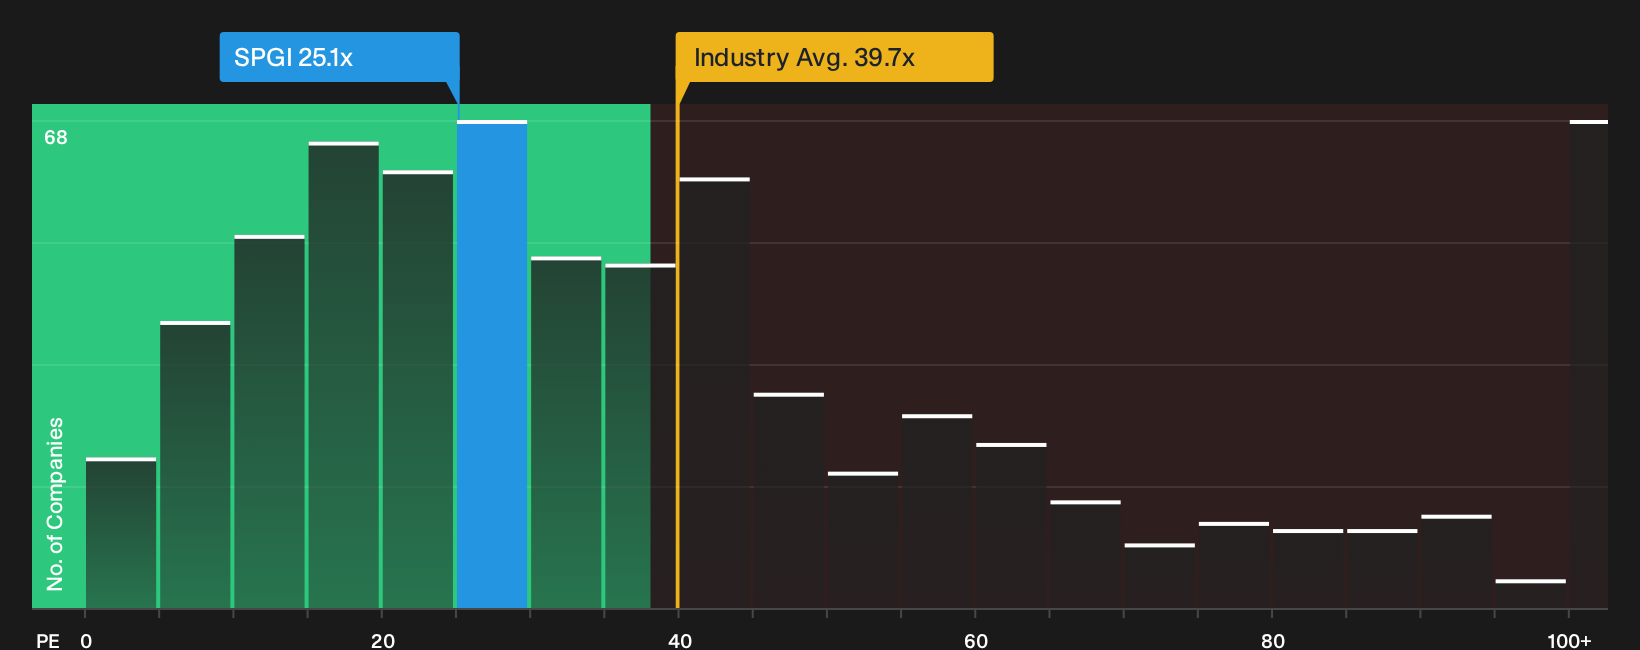
The P/E ratio fits S&P Global because earnings power sits at the center of how investors judge data and analytics platforms. On this lens, the stock trades on about 25.1x earnings, which is almost identical to the peer average of 25.3x for similar businesses and well below the broader capital markets industry on roughly 39.7x.
A more tailored yardstick, the Fair P/E Ratio of 18.1x, suggests investors are paying a much richer price for S&P Global than its risk and earnings profile would typically support. The current multiple sits roughly one third above that fair level, which points to a premium that already assumes a lot about the quality and durability of future profit streams.
On this P/E check, S&P Global stock looks overvalued relative to what the Fair Ratio framework implies investors might usually pay.
See what the numbers say about this price — find out in our valuation breakdown.
The S&P Global Narrative: What Would Justify Today’s Price?
Simply Wall St Narratives for S&P Global pick up where the valuation checks stop and focus on what would actually need to happen next for the share price to make sense. They set out the specific paths for growth, profitability and earnings that sit behind a single model output, so you can watch over time whether S&P Global’s real world progress keeps lining up with the scenario implied on the Community page.
Community views on S&P Global are sharply split, with one camp seeing underappreciated data assets and another worried about AI risk and softer ratings demand.
Bull case: 19% undervalued
“Expansion in the private markets, marked by a 30% year-over-year increase in private markets revenue within the Ratings division, indicates growing market penetration and diversification of revenue sources…”
Read the full Bull Case to see why S&P Global could be undervalued
Bear case: 10% overvalued
“At the same time, there is a structural concern weighing on sentiment: the potential impact of AI on S&P Global’s data and analytics franchises…”
Read the full Bear Case to see why S&P Global could be overvalued
Do you think there’s more to the story for S&P Global? Head over to our Community to see what others are saying!
The Bottom Line
S&P Global screens as roughly fairly priced on the Excess Returns intrinsic value work, yet looks overvalued on the P/E and fair ratio check. That split comes from one framework leaning on long run returns on equity and funding needs, while the market multiple is more about how much growth and quality investors choose to bake into today’s tag. With the valuation score still mixed, the debate now turns on a single question: Do the data and analytics businesses, including the newer infrastructure pieces, prove resilient enough to keep justifying a premium earnings multiple rather than drifting back toward the fair P/E yardstick?
This article by Simply Wall St is general in nature. We provide commentary based on historical data
and analyst forecasts only using an unbiased methodology and our articles are not intended to be financial advice. It does not constitute a recommendation to buy or sell any stock, and does not take account of your objectives, or your
financial situation. We aim to bring you long-term focused analysis driven by fundamental data.
Note that our analysis may not factor in the latest price-sensitive company announcements or qualitative material.
Simply Wall St has no position in any stocks mentioned.
New: Manage All Your Stock Portfolios in One Place
We’ve created the ultimate portfolio companion for stock investors, and it’s free.
• Connect an unlimited number of Portfolios and see your total in one currency
• Be alerted to new Warning Signs or Risks via email or mobile
• Track the Fair Value of your stocks
Have feedback on this article? Concerned about the content? Get in touch with us directly. Alternatively, email editorial-team@simplywallst.com