
Bond Market Gets Edgy as US Treasury Debt Hits $39 Trillion, Spiking by $2 Trillion in 7.5 Months and Not Slowing Down

But debt doesn’t exist in a vacuum: The Debt-to-GDP and Deficit-to-GDP ratios provide (ugly) context.
By Wolf Richter for WOLF STREET.
The US Treasury debt – all Treasury securities outstanding – jumped by another $1 trillion in five months, and by $2 trillion in 7.5 months to $39 trillion now, just a few months away from the glorious $40 trillion milestone, as tax cuts, spending increases, and now the war in Iran are speeding up the process.
Since the debt ceiling in early July, the debt has exploded by $2.8 trillion, with those trillions flying out the window at huge auctions every week so fast they’re hard to see. The illusory flat spots occur during the debt ceiling.
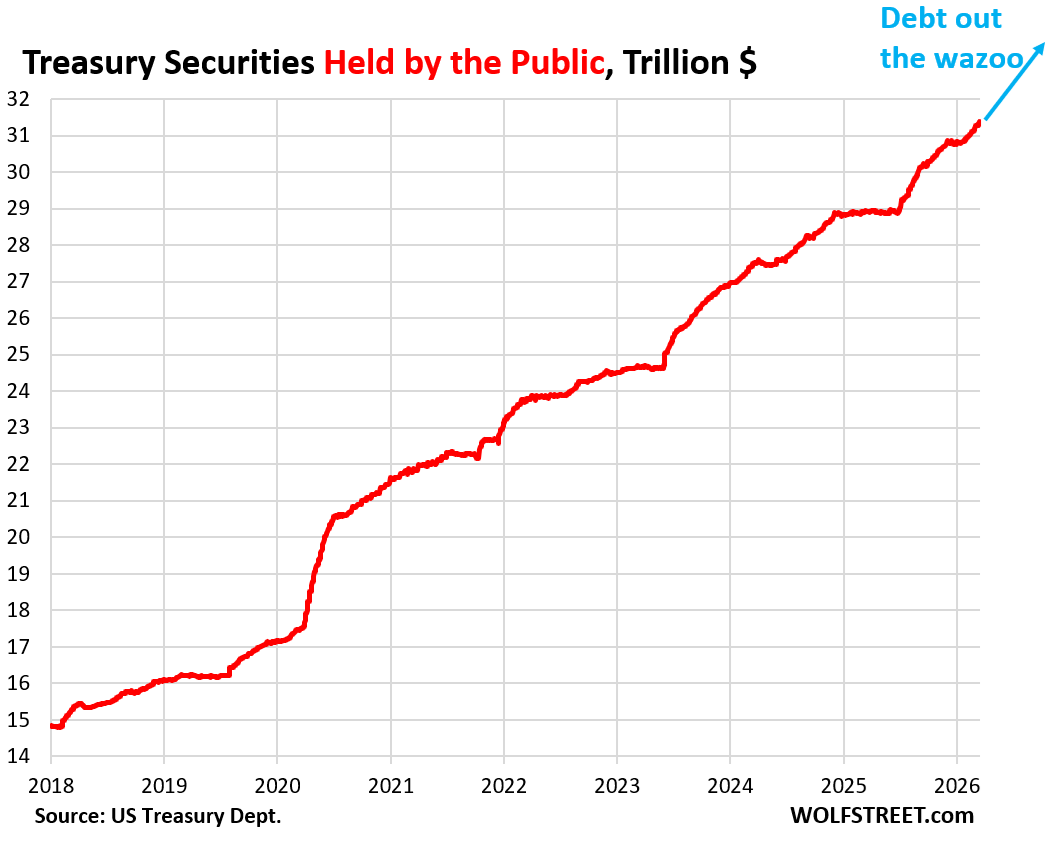
Of that $39 trillion in Treasury securities, $31.4 trillion are “held by the public” – up by $940 billion in five months. They’re the publicly traded Treasury securities held in accounts in the US and around the world, in brokerage accounts, by banks, by insurance companies, at financial centers, by central banks, by the Fed, etc.
That $940 billion increase is the additional supply that bond-market investors had to absorb over those five months.
The remaining $7.6 trillion of the debt is held in federal government pension funds, Social Security Trust Funds, and other “internal” government accounts, and they’re not traded.
There is always enough demand, but at what yield?
Yields rise until there is sufficient demand for the sales to take place. Higher yields create demand. And so there will always be demand for Treasury securities, but the yield might be higher, and those higher yields (= higher interest expense) would then add to the fiscal problems of the government.
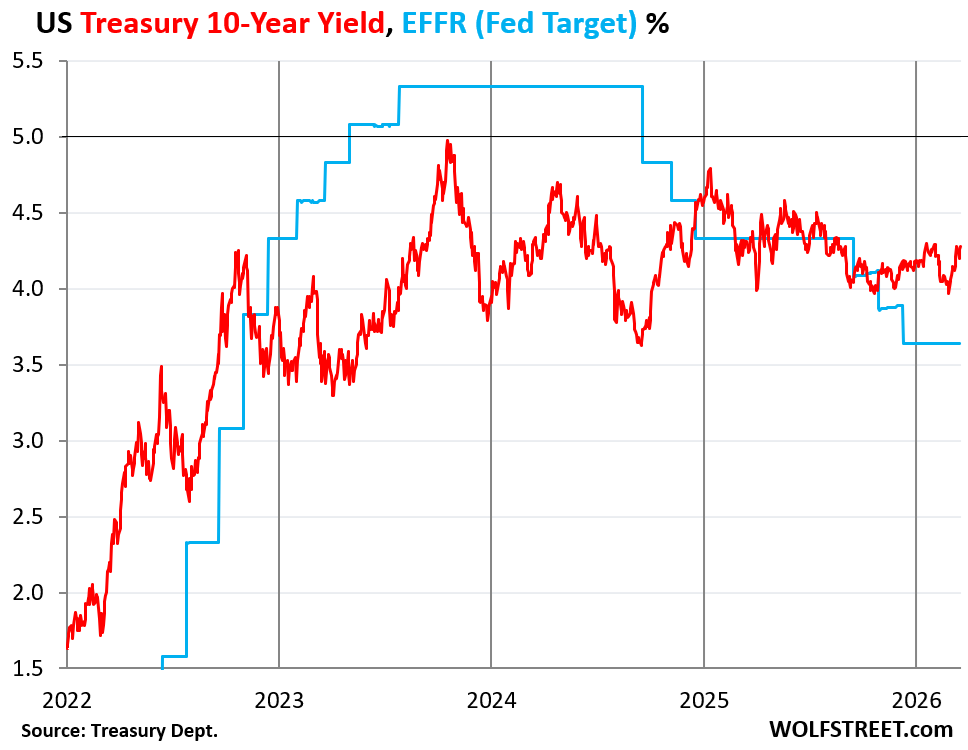
But given the current fiscal situation and the prospects for higher inflation for years to come, yields on longer-term securities are still relatively low:
The 10-year Treasury yield at 4.29% currently is only 1.5 percentage points above the PCE inflation rate (consumer-facing inflation) of 2.8% that is going to soar in coming months on the energy price spike, and 0.5 percentage points above the domestic Q4 GDP inflation rate of 3.8% (overall inflation generated domestically in the economy, excluding imports) that is also going to soar on the energy price spike.
There is a lot of uncertainty about inflation now and how it will develop in future years, with the White House leaning heavily on the Fed to cut rates despite inflation and let inflation do its thing.
All this indicates that there is still ravenous demand for Treasuries, despite all these issues, or else yields would be higher. Over the past few years, any time the 10-year yield approached 5%, demand just exploded and brought yields back down.
That 5% line is the sound barrier that the 10-year yield hasn’t been able to break and stay above for more than a few days since 2000. But in the 35 years before 2000, 5% was the low end of the range.
But debt doesn’t exist in a vacuum.
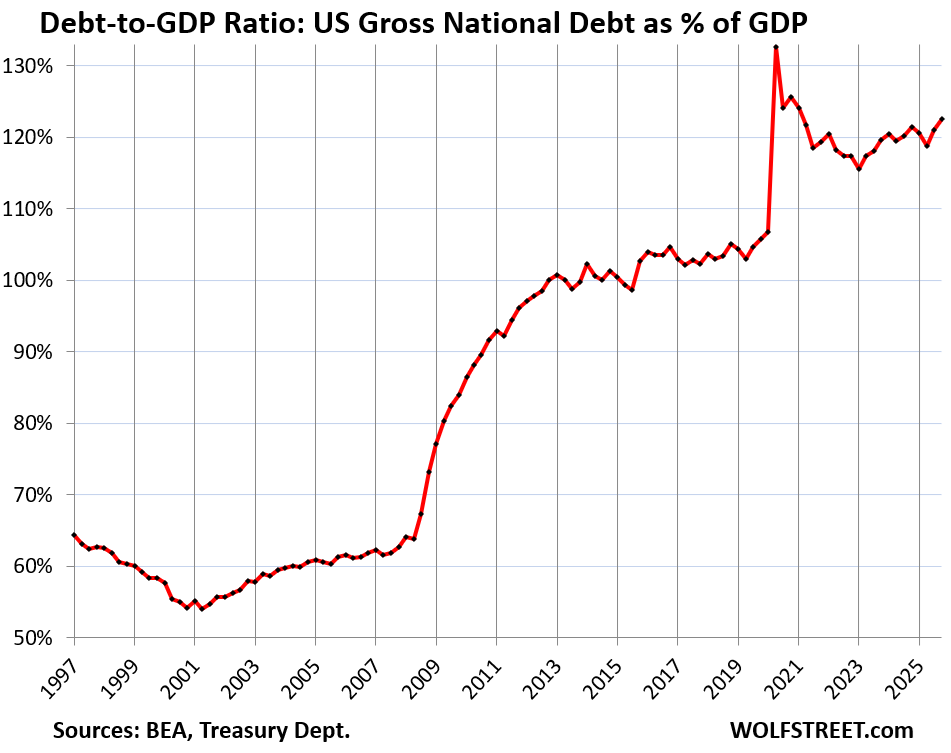
The debt exists within the economy, so it’s useful to look at the relationship of the Treasury debt to GDP, and at the relationship of the federal deficits to GDP (Treasury debt = cumulative federal deficits funded through issuance of Treasury securities; deficits are the annual flow; debt is what accumulates and remains).
The Debt-to-GDP ratio rose to 122.5% at the end of Q4. So that was Q4 nominal GDP and the debt at the end of Q4. But since the end of Q4, the debt has grown by another $500 billion.
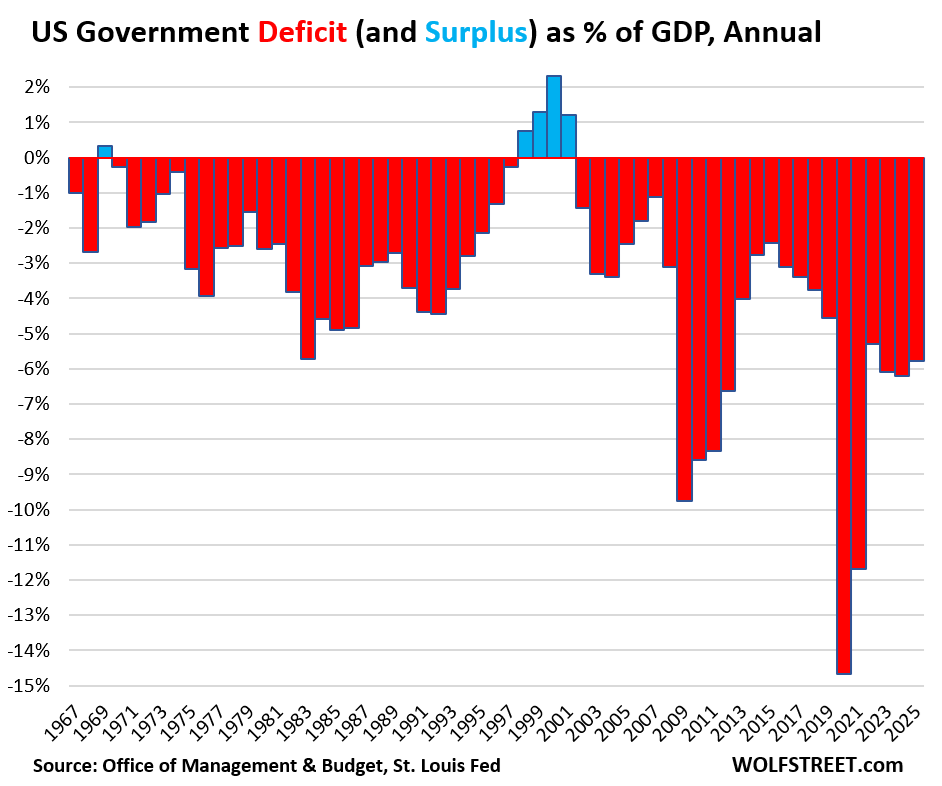
The deficit-to-GDP ratio at the end of 2025 was 5.8%. A slightly smaller deficit and a faster growing economy would improve the situation over time. But a “slightly smaller deficit” seems to not be in the cards any time soon:
Enjoy reading WOLF STREET and want to support it? You can donate. I appreciate it immensely. Click on the mug to find out how:

![]()


