
Is It Too Late To Consider Barrick Mining (B) After 200% One Year Share Price Gain?
 After 200% One Year Share Price Gain?")
- If you are wondering whether Barrick Mining still offers value after its recent run, this article will walk through the key numbers that matter for you as a shareholder or potential investor.
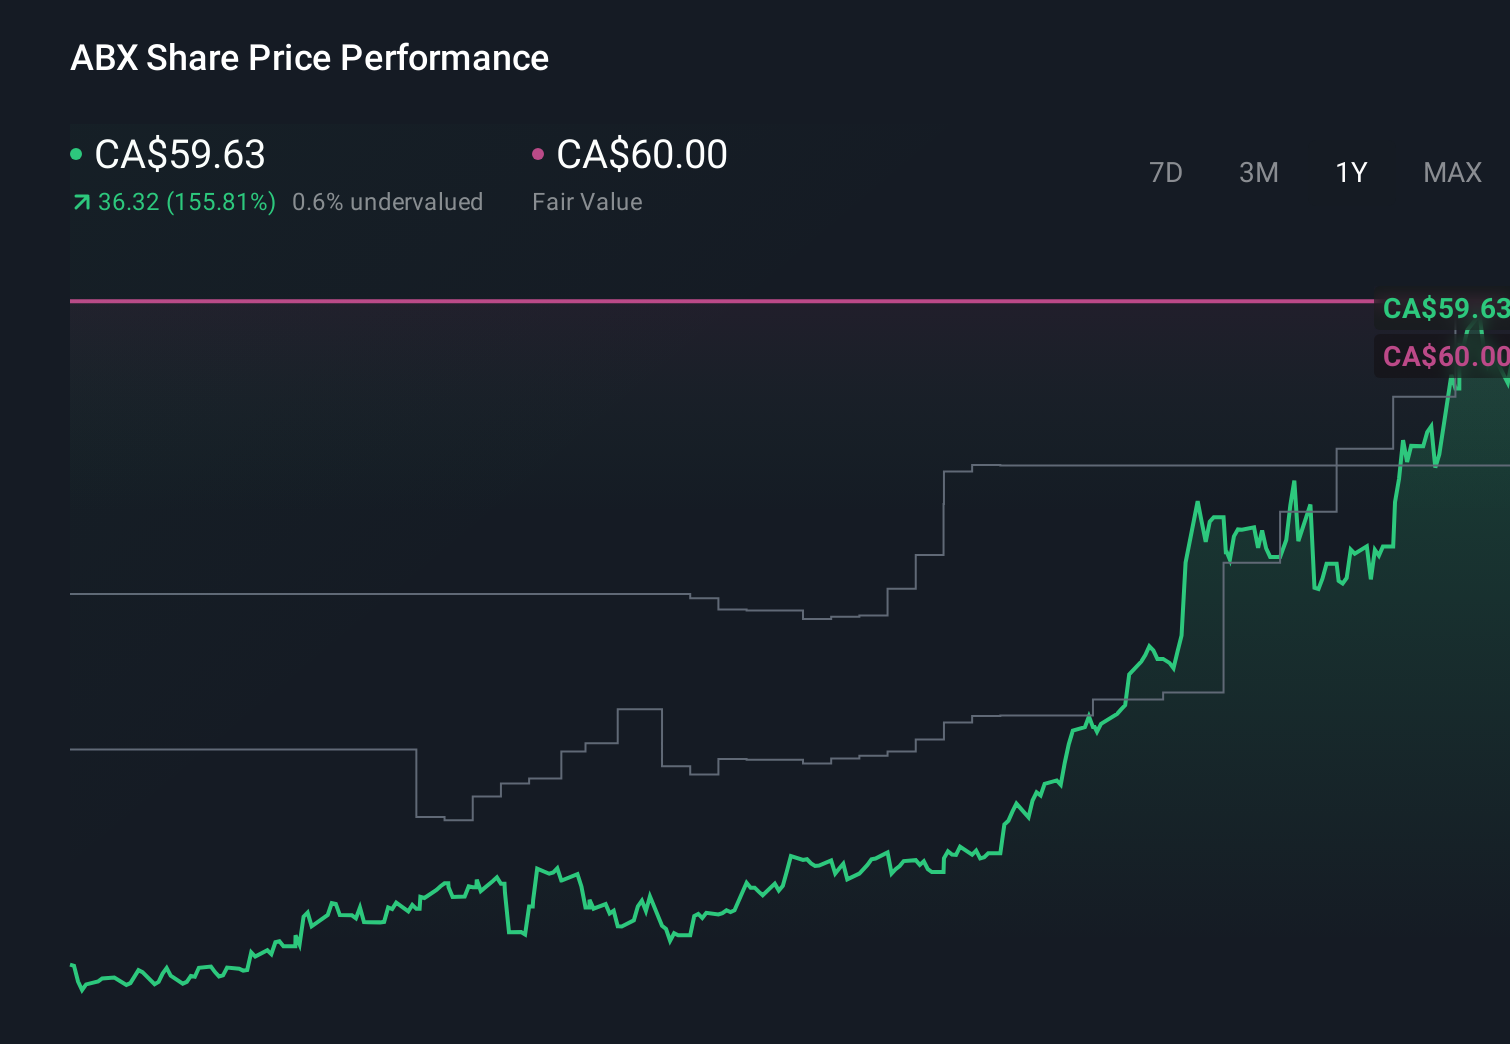
- The stock recently closed at US$45.74, with returns of 3.4% over 7 days, 11.5% over 30 days, 3.8% year to date, 200.0% over 1 year, 152.6% over 3 years and 124.1% over 5 years.
- Recent news has focused on Barrick Mining’s position within the broader materials sector and how investor sentiment around commodity related names has shifted. This has given extra attention to how the market is pricing miners like Barrick compared with their underlying assets and cash flows.
- In our framework, Barrick Mining has a valuation score of 5/6. This sets up a closer look at how different valuation approaches line up and whether a more complete way of thinking about value might matter even more by the end of this article.
Approach 1: Barrick Mining Discounted Cash Flow (DCF) Analysis
A Discounted Cash Flow, or DCF, model looks at the cash Barrick Mining is expected to generate in the future and discounts those projections back to what they might be worth in today’s dollars.
Barrick’s last twelve months Free Cash Flow sits at about $2.57b. Analysts and model projections point to Free Cash Flow of $5.68b in 2026, rising to a projected $10.41b by 2030. Estimates from 2026 to 2030 draw on analyst inputs where available, with later years extrapolated from those forecasts by Simply Wall St.
Using a 2 Stage Free Cash Flow to Equity model, these discounted cash flows produce an estimated intrinsic value of about $130.55 per share. Compared with the recent share price of $45.74, the DCF output suggests the stock is around 65.0% undervalued on this set of assumptions.
This is a model driven view. It sets a clear starting point: the current price sits well below the DCF estimate.
Result: UNDERVALUED
Our Discounted Cash Flow (DCF) analysis suggests Barrick Mining is undervalued by 65.0%. Track this in your watchlist or portfolio, or discover 877 more undervalued stocks based on cash flows.
Approach 2: Barrick Mining Price vs Earnings
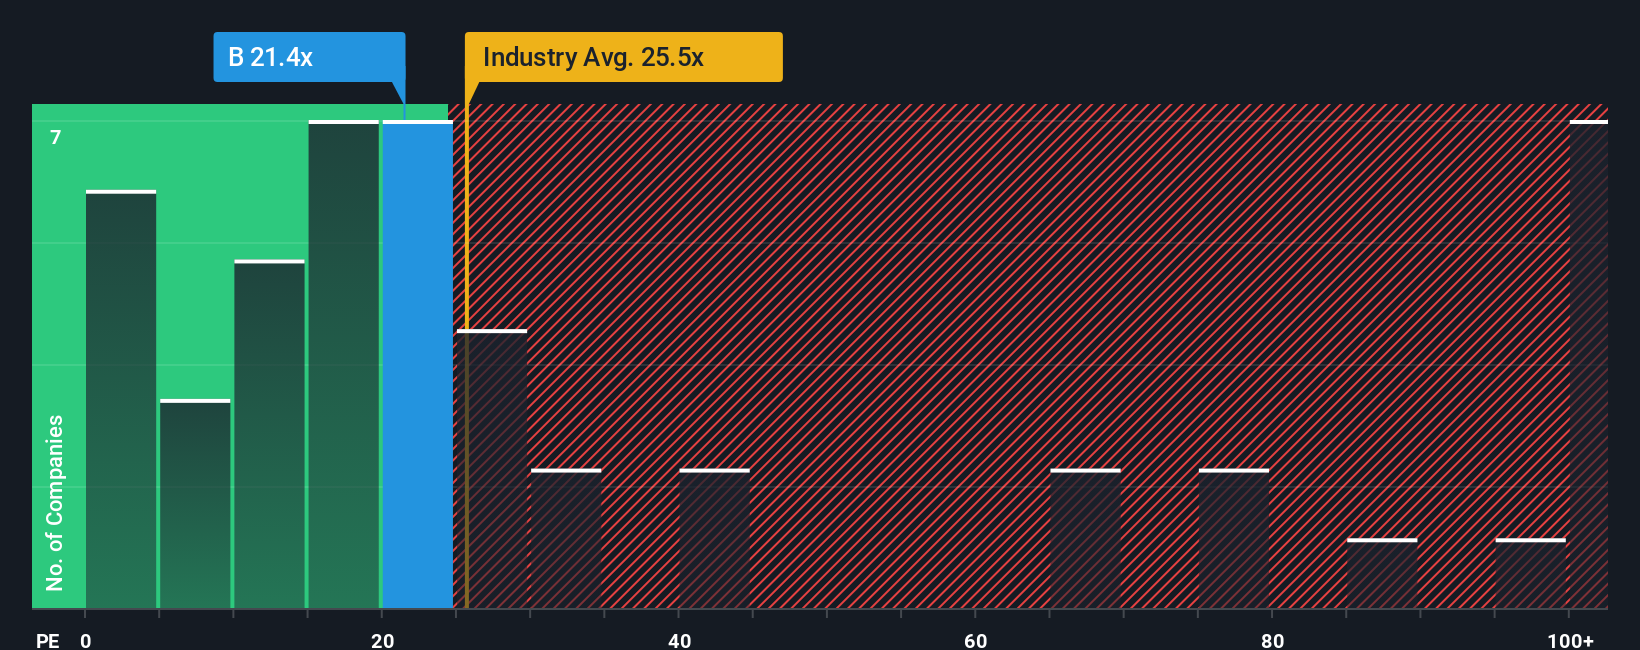
For a profitable company like Barrick Mining, the P/E ratio is a useful way to think about value because it links what you pay for the stock to the earnings the business is currently generating. What counts as a “normal” P/E depends on how fast investors expect earnings to grow and how much risk they see in those earnings, with higher growth and lower perceived risk usually supporting higher P/E levels.
Barrick Mining currently trades on a P/E of 21.56x. That sits below both the Metals and Mining industry average P/E of about 25.51x and the peer group average of 25.34x. Simply Wall St’s Fair Ratio for Barrick Mining is 26.78x, which is its proprietary view of what the P/E might look like after accounting for factors such as earnings growth, profit margins, the company’s industry, market cap and specific risks.
Comparing to a Fair Ratio can be more informative than just lining up the stock against peers or the industry, because it adjusts for these company level differences rather than assuming all miners deserve the same multiple. With Barrick Mining’s actual P/E below the Fair Ratio, this framework points to the shares being undervalued on an earnings basis.
Result: UNDERVALUED
P/E ratios tell one story, but what if the real opportunity lies elsewhere? Discover 1459 companies where insiders are betting big on explosive growth.
Upgrade Your Decision Making: Choose your Barrick Mining Narrative
Earlier we mentioned that there is an even better way to understand valuation. Let us introduce you to Narratives, which are simply your story about Barrick Mining translated into numbers like future revenue, earnings, margins and a fair value. These can then be compared with today’s price on Simply Wall St’s Community page, where different investors can hold very different views. For example, one Narrative might assume a fair value close to US$20.44 per share with moderate revenue growth and 15% margins. Another could assume a much higher fair value based on expectations of a strong commodity super-cycle, higher gold prices and expanding copper production. Because these Narratives automatically refresh when new news or earnings arrive, you always see how your story lines up against the current market price and can decide whether that gap suggests a potential buying or selling opportunity for you.
Do you think there’s more to the story for Barrick Mining? Head over to our Community to see what others are saying!
This article by Simply Wall St is general in nature. We provide commentary based on historical data
and analyst forecasts only using an unbiased methodology and our articles are not intended to be financial advice. It does not constitute a recommendation to buy or sell any stock, and does not take account of your objectives, or your
financial situation. We aim to bring you long-term focused analysis driven by fundamental data.
Note that our analysis may not factor in the latest price-sensitive company announcements or qualitative material.
Simply Wall St has no position in any stocks mentioned.
Valuation is complex, but we’re here to simplify it.
Discover if Barrick Mining might be undervalued or overvalued with our detailed analysis, featuring fair value estimates, potential risks, dividends, insider trades, and its financial condition.
Have feedback on this article? Concerned about the content? Get in touch with us directly. Alternatively, email editorial-team@simplywallst.com
?")


