
Is SSR Mining (TSX:SSRM) Still Attractive After A 167% One Year Share Price Surge
 Still Attractive After A 167% One Year Share Price Surge")
- For readers wondering if SSR Mining at about $31 a share still offers value after a strong run, this article walks through what the current price might be implying and how that compares with a few different valuation checks.
- The stock has had a mixed short term pattern, with a 13.7% decline over the last 7 days, a 3.2% gain over 30 days, and year to date and 1 year returns of 5.0% and 166.7% respectively. This can influence how the market is thinking about both upside and risk.
- Recent attention on SSR Mining has centered on its position in the precious metals space and how investors are reacting to sector wide headlines, which has kept the share price in focus. In addition, broader commentary on gold related names has kept questions about the sustainability of recent gains front and center for many shareholders.
- On our valuation framework SSR Mining scores a 5/6 valuation check score, which suggests several checks currently flag the shares as potentially undervalued. Next we will walk through the different valuation approaches behind that score before finishing with a way to put those numbers into an even clearer context.
Approach 1: SSR Mining Discounted Cash Flow (DCF) Analysis
A Discounted Cash Flow, or DCF, model aims to estimate what a business is worth today by projecting the cash it could generate in the future and then discounting those cash flows back to the present.
For SSR Mining, the latest twelve month Free Cash Flow is about $179.3 million. Analysts provide explicit forecasts for the next few years, and Simply Wall St extends those into longer term projections using a 2 Stage Free Cash Flow to Equity model. On this basis, projected Free Cash Flow for 2035 is $985.9 million, with interim years such as 2026 and 2028 at $624.0 million and $853.0 million respectively.
When all of these projected cash flows are discounted back to today, the model arrives at an estimated intrinsic value of $103.07 per share. Compared with the current share price of about CA$31, the DCF outcome suggests the stock is trading below this estimated value by 69.9%.
Result: UNDERVALUED
Our Discounted Cash Flow (DCF) analysis suggests SSR Mining is undervalued by 69.9%. Track this in your watchlist or portfolio, or discover 868 more undervalued stocks based on cash flows.
Approach 2: SSR Mining Price vs Earnings
P/E is a useful yardstick for a profitable company because it directly links what you pay per share to the earnings that each share generates. It helps you see how much the market is currently willing to pay for those earnings.
What counts as a “normal” or “fair” P/E usually reflects how the market sees a stock’s growth potential and risk. Higher expected growth or lower perceived risk can support a higher P/E, while slower growth or higher risk usually point to a lower one.
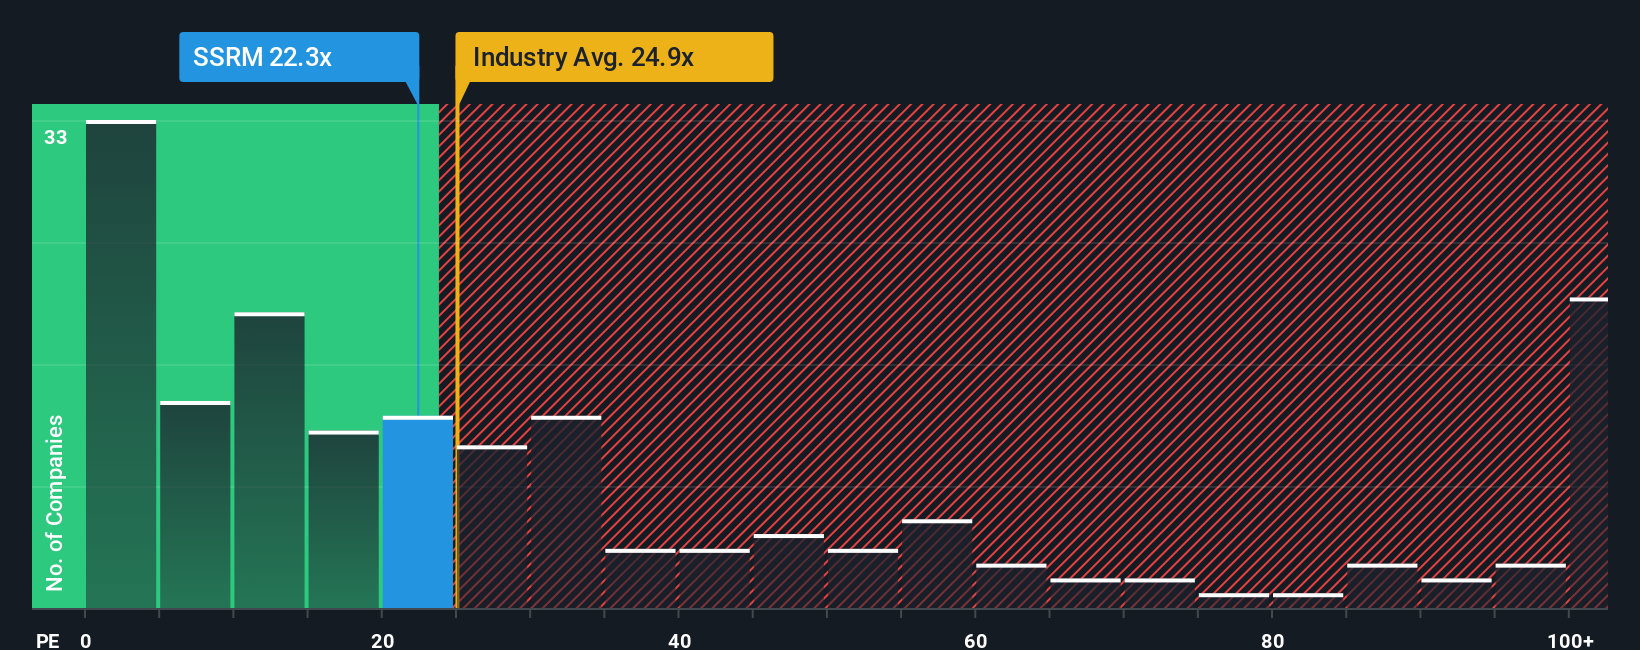
SSR Mining currently trades on a P/E of 21.0x. That sits below the Metals and Mining industry average of about 27.8x and also below the peer group average of 26.3x. On the surface, that suggests the shares are priced more cautiously than many peers.
Simply Wall St’s Fair Ratio is a proprietary estimate of what P/E might be reasonable for SSR Mining, given its earnings profile, industry, profit margins, market cap and company specific risks. Because it pulls these factors together, Fair Ratio can be more tailored than simple peer or industry comparisons.
For SSR Mining, the Fair Ratio is 41.0x, which is well above the current P/E of 21.0x, implying the shares look undervalued on this metric.
Result: UNDERVALUED
P/E ratios tell one story, but what if the real opportunity lies elsewhere? Discover 1417 companies where insiders are betting big on explosive growth.
Upgrade Your Decision Making: Choose your SSR Mining Narrative
Earlier we mentioned that there is an even better way to understand valuation, so let us introduce you to Narratives, which let you attach a clear story, your view on future revenue, earnings and margins, to the numbers behind a stock.
A Narrative connects three pieces for you: what you think is happening with the business, how that translates into a financial forecast, and the fair value that drops out of those assumptions.
On Simply Wall St, Narratives sit inside the Community page and are designed to be quick to set up. You can adjust key drivers like growth, profitability and required return without needing a spreadsheet.
Once you have a Narrative, it can help you decide what to do by comparing your Fair Value to the current market price. This can highlight when a share looks cheap enough to consider buying or stretched enough to consider selling.
Narratives also update when fresh information comes in, for example earnings releases or news, so your story and the fair value that follows from it can keep up with the latest data rather than staying frozen in time.
For SSR Mining, one investor might see a relatively cautious outlook and arrive at a fair value well below today’s price, while another might build a more optimistic case and reach a fair value comfortably above the market level.
Do you think there’s more to the story for SSR Mining? Head over to our Community to see what others are saying!

This article by Simply Wall St is general in nature. We provide commentary based on historical data
and analyst forecasts only using an unbiased methodology and our articles are not intended to be financial advice. It does not constitute a recommendation to buy or sell any stock, and does not take account of your objectives, or your
financial situation. We aim to bring you long-term focused analysis driven by fundamental data.
Note that our analysis may not factor in the latest price-sensitive company announcements or qualitative material.
Simply Wall St has no position in any stocks mentioned.
New: Manage All Your Stock Portfolios in One Place
We’ve created the ultimate portfolio companion for stock investors, and it’s free.
• Connect an unlimited number of Portfolios and see your total in one currency
• Be alerted to new Warning Signs or Risks via email or mobile
• Track the Fair Value of your stocks
Have feedback on this article? Concerned about the content? Get in touch with us directly. Alternatively, email editorial-team@simplywallst.com


 Valuation As Brook Mine Rare Earth Opportunity Emerges Beyond Coal")
