
The Bond Market Is Not Waiting for the Fed

Image by Monkey Business Images via Shutterstock
In the chart below, a busy one, I’ve highlighted a couple of key areas. To me, they tell the story that some, including me, think of as the “rate cut nobody saw.” Because the Fed didn’t do it, the market did. And it was not overnight rates, it was just a bit further up the yield curve, in the two-to-five-year segment. Here’s why it matters.
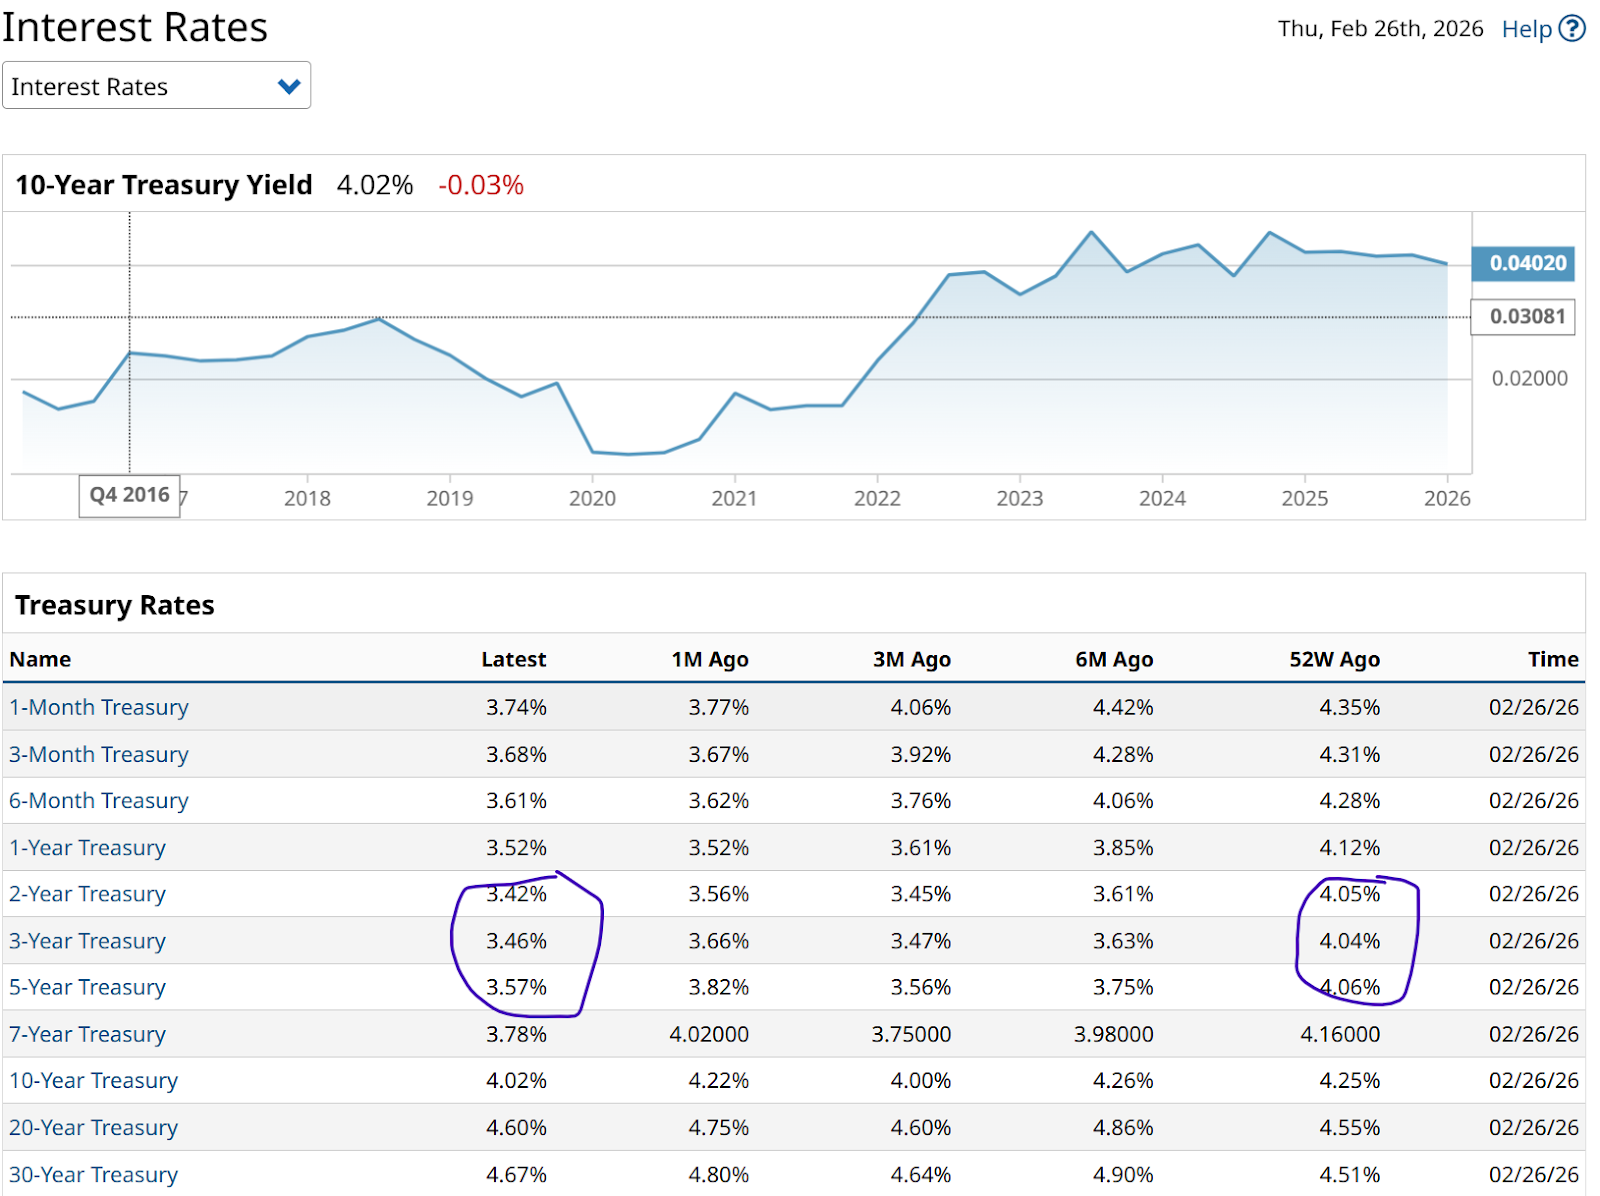
A quiet but significant shift is occurring in the fixed-income market. While the Federal Reserve officially held interest rates steady at 3.5% to 3.75% during its January meeting, actual market rates for short-term borrowing have begun to drift lower on their own.
This decline is being led by a sharp drop in Treasury yields across the entire curve, with the 10-year Treasury Note (ZNM26) briefly dipping below 4.02% to reach a new low for 2026. Even more notable for short-term traders is the behavior of the 2-year Treasury note (ZTM26), which ended last week at 3.48%, well below the official Fed funds target.
The Shadow (Rate Cut) Knows!
This shadow rate cut is being driven by a unique combination of technical factors and a sudden shift in the market narrative. One of the primary drivers is the Fed’s transition from quantitative tightening to a new phase of balance-sheet expansion known as reserve management purchases.
By purchasing up to $40 billion a month in Treasury bills and short-term coupon bonds, the central bank is actively injecting liquidity into the money markets to prevent a repeat of past repo market strains. This increased demand for short-dated debt has naturally exerted downward pressure on yields, effectively easing financial conditions without an official announcement from the FOMC.
The secured overnight financing rate, or SOFR, which underpins trillions of dollars in derivatives and loans, has mirrored this trend. Recent data shows the 90-day and 180-day average SOFR rates trending downward, reflecting a broader measure of cheaper borrowing costs for financial institutions.
Market participants are also assessing a new type of “fear trade.” This one is related to the long-term impact of artificial intelligence (AI) on the labor market. Anxiety over AI’s potential to disrupt U.S. employment has prompted a flight to quality, leading investors to scoop up government debt as a defensive hedge, further pushing yields lower.
This decoupling between official Fed policy and market yields has significant implications for consumers. Mortgage rates, which typically follow the 10-year Treasury yield, have finally slipped below the 6% threshold for the first time in three and a half years.
What Lower Mortgage Rates Mean to Consumers
The benchmark 30-year fixed mortgage rate fell under 6% this week, providing a sudden boost to affordability just as the spring home-buying season begins. For businesses, the drop in short-term rates lowers the cost of funding working capital and revolving credit lines, providing a stealth stimulus to the corporate sector.
This chart does not require fancy technical analysis. It just goes up — at least over the past couple of years. And the more rates decline, while the rate on short-term Treasurys, and thus the yield of the 1-3 Year Treasury Bond Ishares ETF (SHY), will decline, there is some offset in the form of price appreciation.
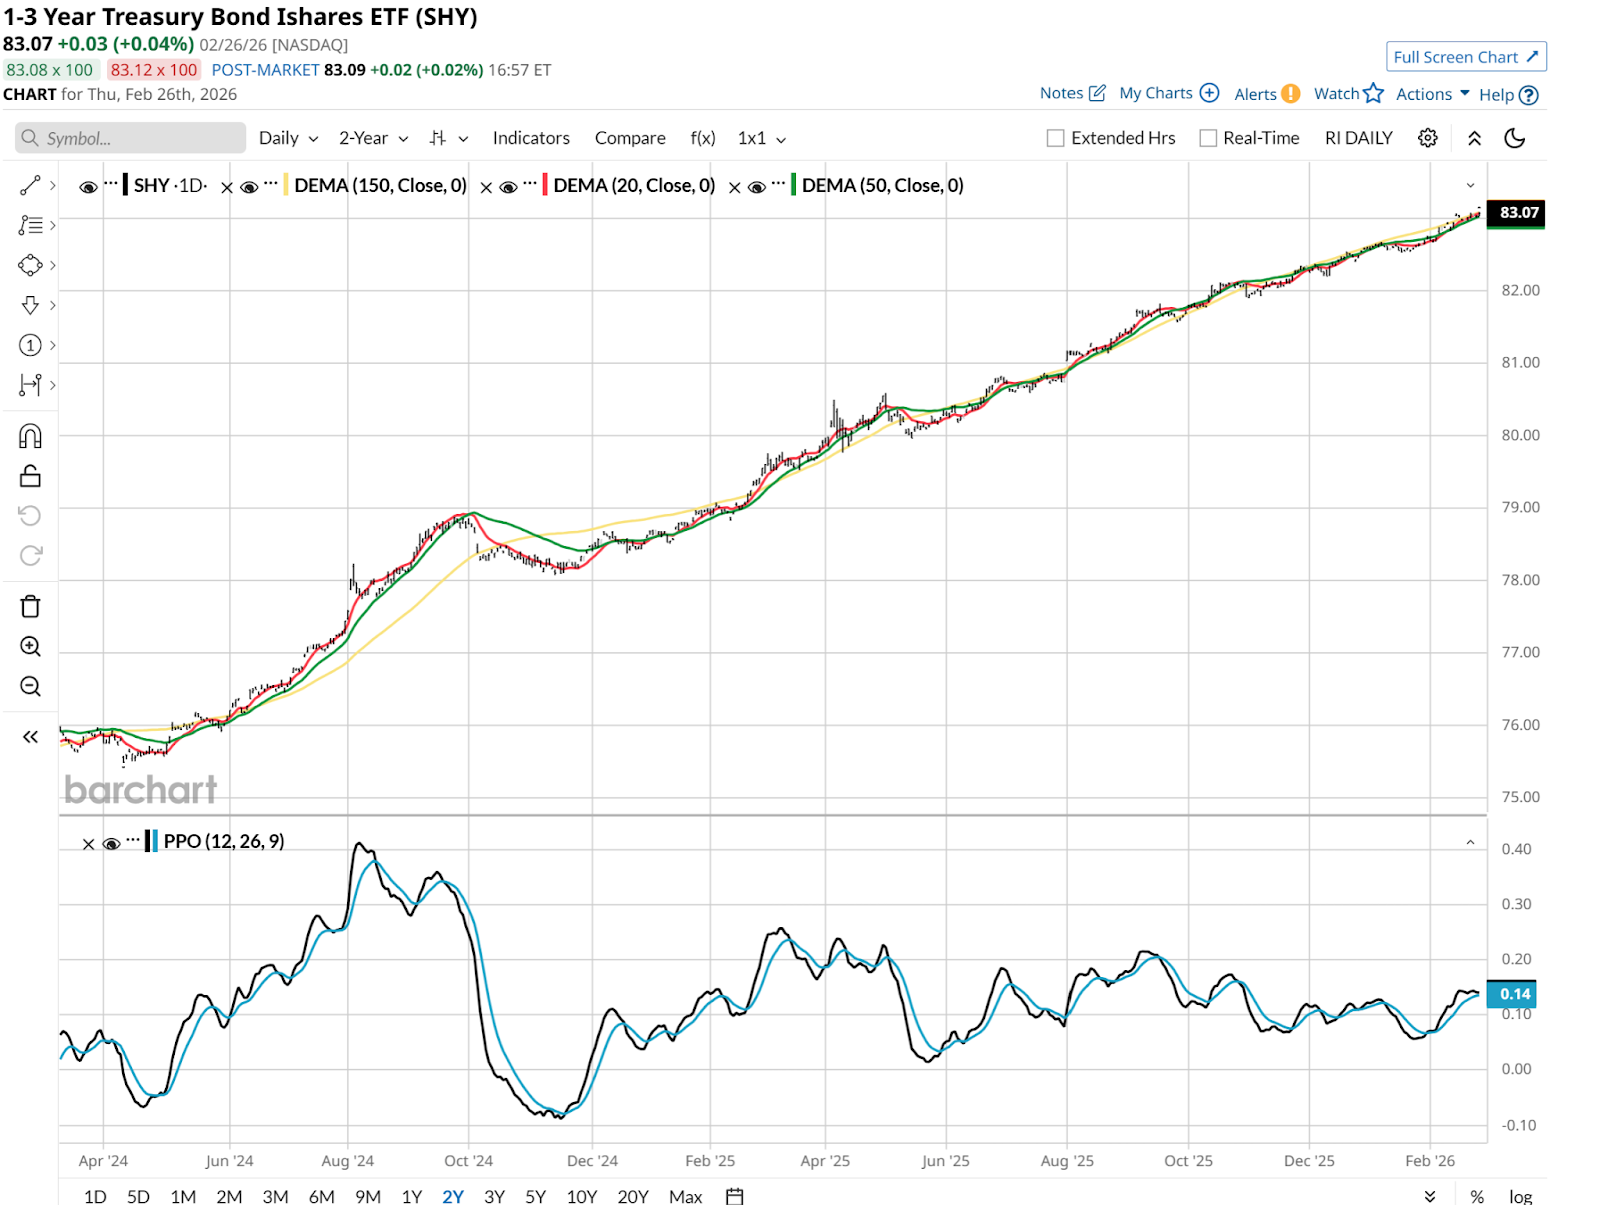
While that is typically small in magnitude, I can recount from personal experience that SHY was a performance booster for my portfolio during 2020’s pandemic crash. If we get a different variety of sudden market “freak out,” keep in mind that short-term fixed income, high quality in particular, can be a potent offensive weapon.
While the Fed’s next move is a subject of constant debate, there’s something that matters more. What rates and bond prices actually do. Sometimes, as is the case early this year, while some are focused on the Fed, the market takes care of business without it.
Rob Isbitts created the ROAR Score, based on his 40+ years of technical analysis experience. ROAR helps DIY investors manage risk and create their own portfolios. For Rob’s written research, check out ETFYourself.com.
On the date of publication, Rob Isbitts did not have (either directly or indirectly) positions in any of the securities mentioned in this article. All information and data in this article is solely for informational purposes. For more information please view the Barchart Disclosure Policy here.


