
The ‘double top’ in U.S. Treasury bonds is putting pressure on gold, with its fate hanging by a thread at 5,000! This weekend, could this be the last lifeline for the bulls?

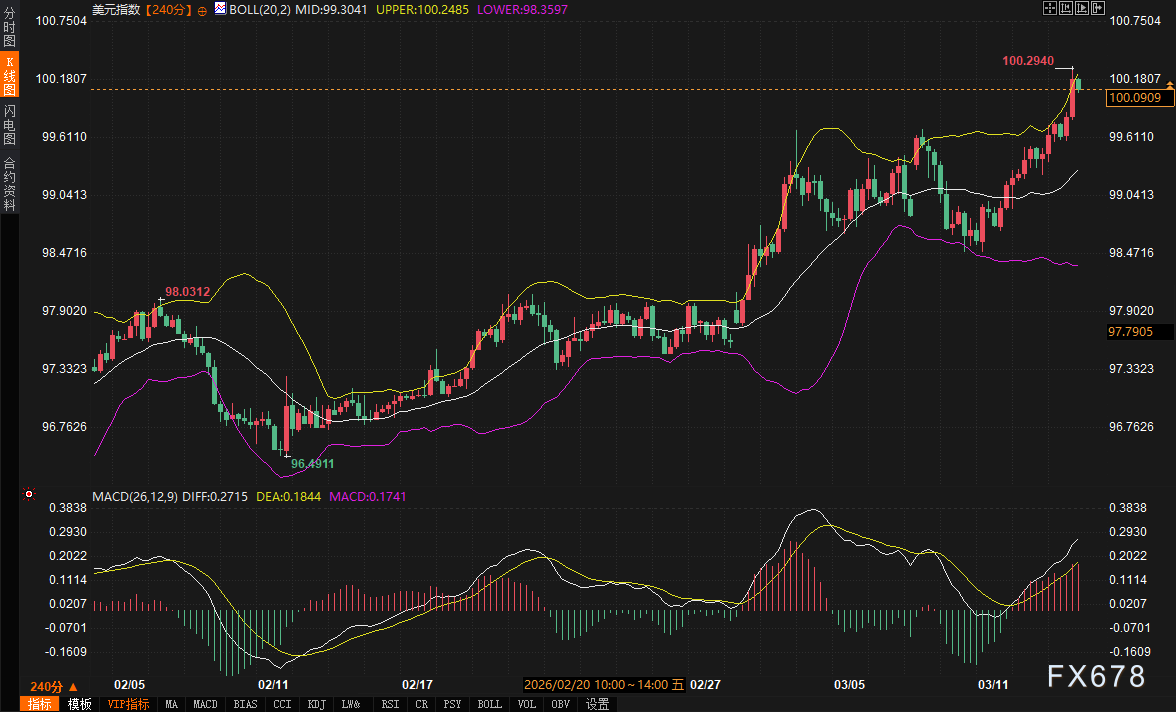
On Friday (March 13), global financial markets are at the confluence of multiple macro pressures. Amid persistent disruptions from geopolitical tensions in the Middle East and fluctuations in energy prices, U.S. Treasury yields and the U.S. Dollar Index have recently exhibited a strong co-expansion trend. The latest data shows that the U.S. Dollar Index has surged to around 100.0909, hovering near the upper Bollinger Band, with significant inflows of risk-averse capital into the dollar. This has created evident pressure on traditional safe-haven assets, particularly spot gold.
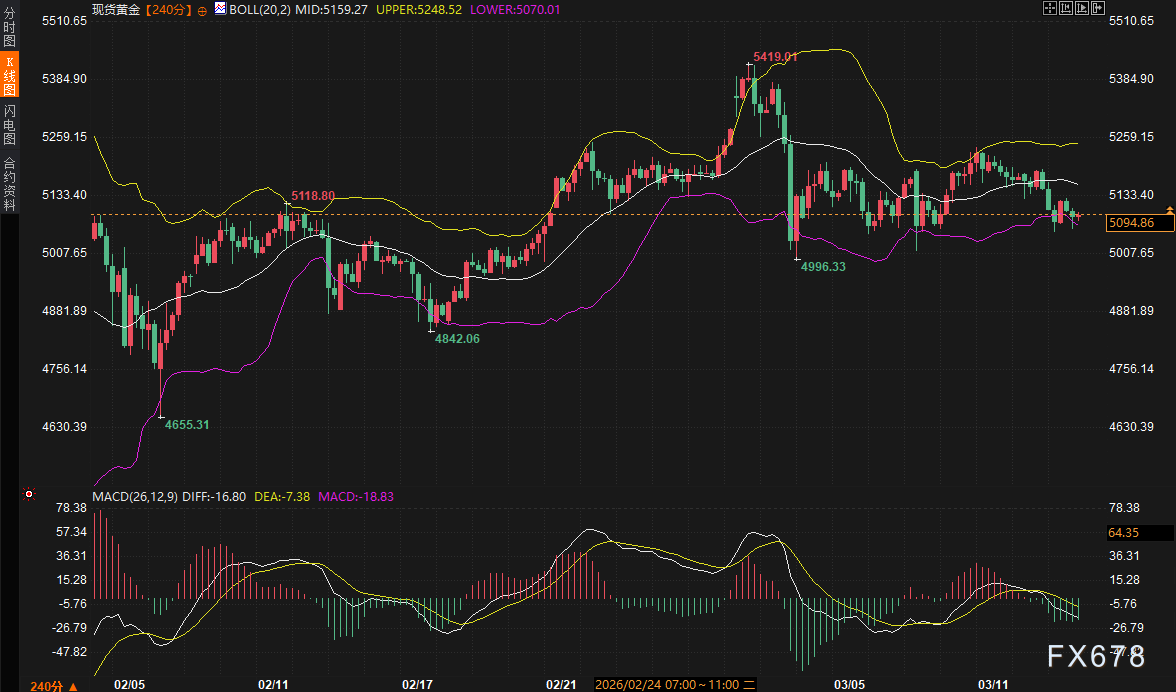
Currently, market attention is highly focused on the upcoming release of the U.S. January core PCE price index. Due to the resilience shown in earlier inflation data, the market broadly anticipates that this indicator’s year-on-year growth rate may reach 3.1%, far exceeding the Federal Reserve’s annual target of 2.5%. This expectation of “high inflation, high interest rates” has significantly reduced market bets on the Fed cutting interest rates this year, with a 50% probability now assigned to no rate cuts throughout the year. Against this backdrop, elevated U.S. Treasury yields have directly increased the opportunity cost of holding gold, with spot gold trading under pressure at $5094.86, leading to heightened short-term volatility.
U.S. Treasury Yields Form ‘Double Top’ Pressure: Positioning Game amid Inflation Expectations
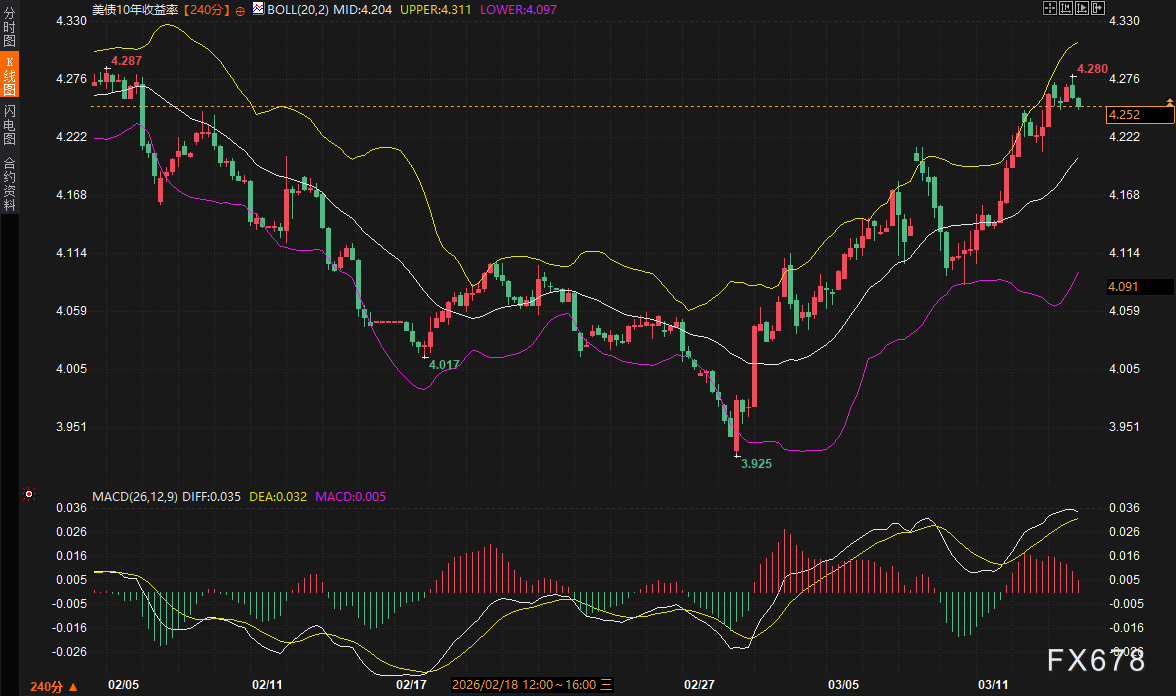
The recent movement in the U.S. Treasury market has been the core driver of global asset pricing. The 10-year U.S. Treasury yield is currently quoted at 4.252%, within a strong range between the middle Bollinger Band at 4.204 and the upper band at 4.311. From a technical perspective, after retreating from a high of 4.287 in early February, the yield has recently rebounded to near 4.280, forming a clear potential double-top structure.
 Fundamental Support: Prominent institutions have noted that current inflationary pressures were already showing signs before external factors intervened. The January core PCE is expected to grow by 0.4% month-on-month, reflecting persistent stickiness in service-sector inflation. Coupled with energy prices previously approaching triple-digit levels, selling pressure in the bond market has continued to build.
Technical Resistance: Although the MACD indicator lines have crossed above the zero axis, the red histogram has contracted sharply, suggesting that upward momentum is waning. If the yield fails to break through the previous resistance level of 4.287 effectively, it is highly likely to see a pullback from the elevated range. Conversely, if this level is breached, it could open up further upside potential towards 4.32%.
Transmission of Safe-Haven Effects: While geopolitical tensions in Ukraine-Russia and the Middle East should theoretically support a flight to safety in bonds (with falling yields), the prevailing logic of ‘energy-driven inflation’ has overshadowed the ‘pure safe-haven’ rationale. Investors fear that prolonged high inflation will force interest rates to remain elevated, and this expectation of ‘higher for longer’ has led to a selloff in the bond market, keeping yields volatile at high levels.
U.S. Dollar Index Nears Key Resistance: Intense Competition Amid Exchange Rate Premiums
Driven by the strengthening of U.S. Treasury yields, the U.S. Dollar Index has demonstrated ‘extreme strength.’ Currently quoted at 100.0909, the candlestick chart shows steady upward movement along the upper Bollinger Band. With both the euro and the pound being sold off due to weak economic data, the dollar’s role as the sole safe-haven currency has been magnified.
From a technical perspective, the MACD red histogram for the U.S. Dollar Index persists, indicating a clear bullish trend. However, the DIFF and DEA lines have entered overbought territory, necessitating caution against a potential pullback from overextended highs. The key resistance zone lies between 100.18 and 100.29 (near the previous high). If there is no substantial breakout in this area, the dollar may face a short-term technical correction. Nevertheless, as long as U.S. Treasury yields remain above 4.2%, downside risks for the dollar will be tightly constrained.
Focus on Gold and Bond Market Transmission: The ‘Identity Reshaping’ of Safe-Haven Assets
Under the dual pressure of U.S. Treasury bonds and the U.S. dollar, spot gold has shown weak performance recently, recording a second consecutive weekly decline. Gold exhibits significant characteristics of a pullback consolidation in the 4-hour cycle (240 minutes).
1. Logic of Transmission Mechanism: Typically, geopolitical risks (such as the current Russia-Ukraine situation and Middle East tensions) would boost gold prices. However, when the U.S. dollar and U.S. Treasury yields soar simultaneously, the currency attribute of gold is suppressed. Some investors even choose to liquidate gold to cover margin requirements amid fluctuations in the stock or oil markets.
2. Technical Analysis: Spot gold is currently quoted at $5094.86, near the lower Bollinger Band at $5070. The MACD green histogram continues to expand, indicating that bearish momentum is still being released. The K-line repeatedly oscillates within the $5000-$5150 range, showing intense disagreement between bulls and bears around the $5000 level.
3. Key Defensive Levels: Short-term core support is seen at $4996.33. If gold breaks below this level, the pullback could deepen further; resistance above is focused on the upper boundary of the consolidation platform at $5118.80.
Outlook and Range Prediction for the Next 2-3 Days
Looking ahead to the next two trading sessions, the market will experience the release of core PCE data and a flurry of economic indicators. Given the approaching Federal Reserve interest rate decision meeting next week, the market is likely to remain highly volatile.
Outlook on U.S. Treasury Bonds and the Dollar: The yield on the 10-year U.S. Treasury bond is expected to fluctuate significantly within the range of 4.23%-4.29%. If the PCE data rises as expected, the yield may again test the double-top resistance at 4.287. The U.S. Dollar Index needs to be monitored for its resistance level within the 100.18-100.36 range. Due to the interest rate differential advantage, the dollar is unlikely to see a deep retracement in the short term.
Gold Price Forecast: Before the bond market strengthens, gold’s rebound potential remains limited. The expected fluctuation range is between $4996 and $5120.
Key Considerations: Closely monitor whether the 10-year U.S. Treasury yield forms a pullback near 4.28%. If the yield surges and then retreats, gold may stabilize above the $5070 support level and attempt a corrective rebound. If the U.S. Dollar Index firmly holds above 100.30, gold faces the risk of breaking below the $5000 level.
Frequently Asked Questions
Q1: Why hasn’t geopolitical risk sentiment driven a significant rise in gold, but instead boosted the US dollar?
In the current macroeconomic environment, the US dollar is gradually replacing gold as the “primary safe-haven choice” for global investors. This is primarily because geopolitical conflicts (such as those in the Middle East) have directly driven up crude oil prices, and rising oil prices have triggered extreme market concerns about a rebound in inflation. Rising inflation expectations lead to higher US Treasury yields, with which the US dollar has a strong positive correlation. When the US dollar exhibits both “high yield” and “safe-haven” attributes, gold, which does not generate interest income, becomes relatively less attractive, causing capital to flow into the dollar rather than gold.
Q2: What are the implications of the “double-top pattern” mentioned regarding US Treasury yields for future trends?
The “double top” is an important topping signal in technical analysis. The repeated resistance faced by the 10-year US Treasury yield in the range of 4.28%-4.29% indicates substantial buyback demand or resistance to high rates at that level. If, in the next 2-3 days, the yield fails to break through the previous high of 4.287 with significant volume, it suggests that selling pressure in the bond market may be temporarily exhausted, leading to a decline in yields. This represents a crucial turning point for gold, as falling yields typically ease valuation pressures on gold.
Q3: If the upcoming core PCE data exceeds expectations, how will it impact gold through the bond market?
The transmission mechanism is as follows: Higher-than-expected core PCE → Market confirms persistent inflation → Expectations for Fed rate cuts further diminish (or even shift toward expectations for rate hikes) → The 10-year US Treasury yield breaks through the key resistance at 4.287 → The US Dollar Index strengthens simultaneously → Gold, with its safe-haven premium offset, falls below the 5,000 mark due to rising holding costs.
Q4: The article mentions that investors sold gold to “offset gains and losses.” How should this be understood?
This reflects a typical liquidity spillover effect. When sharp fluctuations in global stock or energy markets cause large institutional investors to incur losses or face urgent margin calls, gold, as one of the most liquid assets globally, is often the first to be liquidated to generate cash flow. This selling is not due to deteriorating fundamentals of gold but rather because gold acts as a “liquidity ATM.” This phenomenon is very common in the early stages of financial turbulence and often causes short-term price movements in gold that deviate from its fundamentals.
Q5: Is the support logic for gold near the 5,000-dollar level currently robust?
From a technical perspective, 5,000 dollars is not only a key psychological round-number level but also a strong support zone near the March low of 4,996. Additionally, despite the strength of the US dollar, the complexity of the situation in the Middle East (e.g., issues related to maritime passages) continues to provide defensive buying support at the bottom for gold. As long as there is no extreme upward breakout in Treasury yields (e.g., sustained levels above 4.35%), buying interest in gold around the 5,000-dollar level will remain strong, demonstrating significant resilience against declines.

 Sees a More Significant Dip Than Broader Market: Some Facts to Know")


