
Under triangular compression, is gold awaiting a directional breakout?

On Monday, April 6, the spot gold price hovered narrowly around $4,660 per ounce, continuing its recent pressure trend. The US Dollar Index traded near the 99.90 level. Although geopolitical tensions between the US and Iran continued to escalate, more market capital flowed into the US dollar for liquidity support rather than traditional safe-haven assets. The robust March US non-farm payroll data, coupled with adjusted expectations of the Federal Reserve’s interest rate path, further constrained gold’s upward potential. Despite lingering global uncertainties, gold remains trapped in a range-bound pattern in the short term.
Divergence of Capital Flows Amid Rising Geopolitical Risks
Tensions between the US and Iran have significantly intensified recently, with the US President publicly warning of possible actions targeting Iranian infrastructure while emphasizing severe consequences if shipping through the Strait of Hormuz is disrupted. Iran responded with strong rhetoric, raising risks of conflict spillover and heightening uncertainty in the global energy supply chain. Against this backdrop, oil price volatility increased, but gold failed to strengthen as traditionally expected.
In the current environment, while geopolitical conflicts increase safe-haven demand, the reserve status of the US dollar makes it the preferred shelter. Capital outflows from non-interest-bearing assets like gold shifted towards higher-yielding US dollar-denominated instruments, partially weakening gold’s traditional safe-haven appeal. Traders are closely watching developments in the Strait of Hormuz, as any actual disruption could indirectly affect global risk pricing. However, the current market reaction indicates that the premium on US dollar liquidity dominates short-term sentiment.
US Economic Data Supports the Dollar and Yields
 The US March non-farm payroll report showed an addition of 178,000 jobs, surpassing market expectations, while the unemployment rate fell back to 4.3%. This data reflects stronger-than-expected resilience in the labor market, directly undermining market bets on a near-term interest rate cut by the Federal Reserve.
| Metrics | March Actual | Market Expectations | Previous Value |
|---|---|---|---|
| Non-farm Payroll Increase (in thousands) | 17.8 | Approximately 6.0 | -13.3 |
| Unemployment Rate (%) | 4.3 | 4.4 | 4.4 |
The US Dollar Index thus gained support, with the 10-year Treasury yield remaining at a high of around 4.36%. Economic data drove up real yields, increasing the opportunity cost of holding gold. If employment data continues to show strength, the Federal Reserve’s policy will remain cautious, further suppressing gold valuations.
Technical compression patterns signal directional breakout.
Spot gold is currently in a symmetrical triangle consolidation range, with gradually declining highs and progressively rising lows, indicating a balance between bullish and bearish forces but with narrowing volatility. This pattern is typically accompanied by the accumulation of potential energy, and once the upper or lower boundary is breached, it will trigger a significant trend movement.
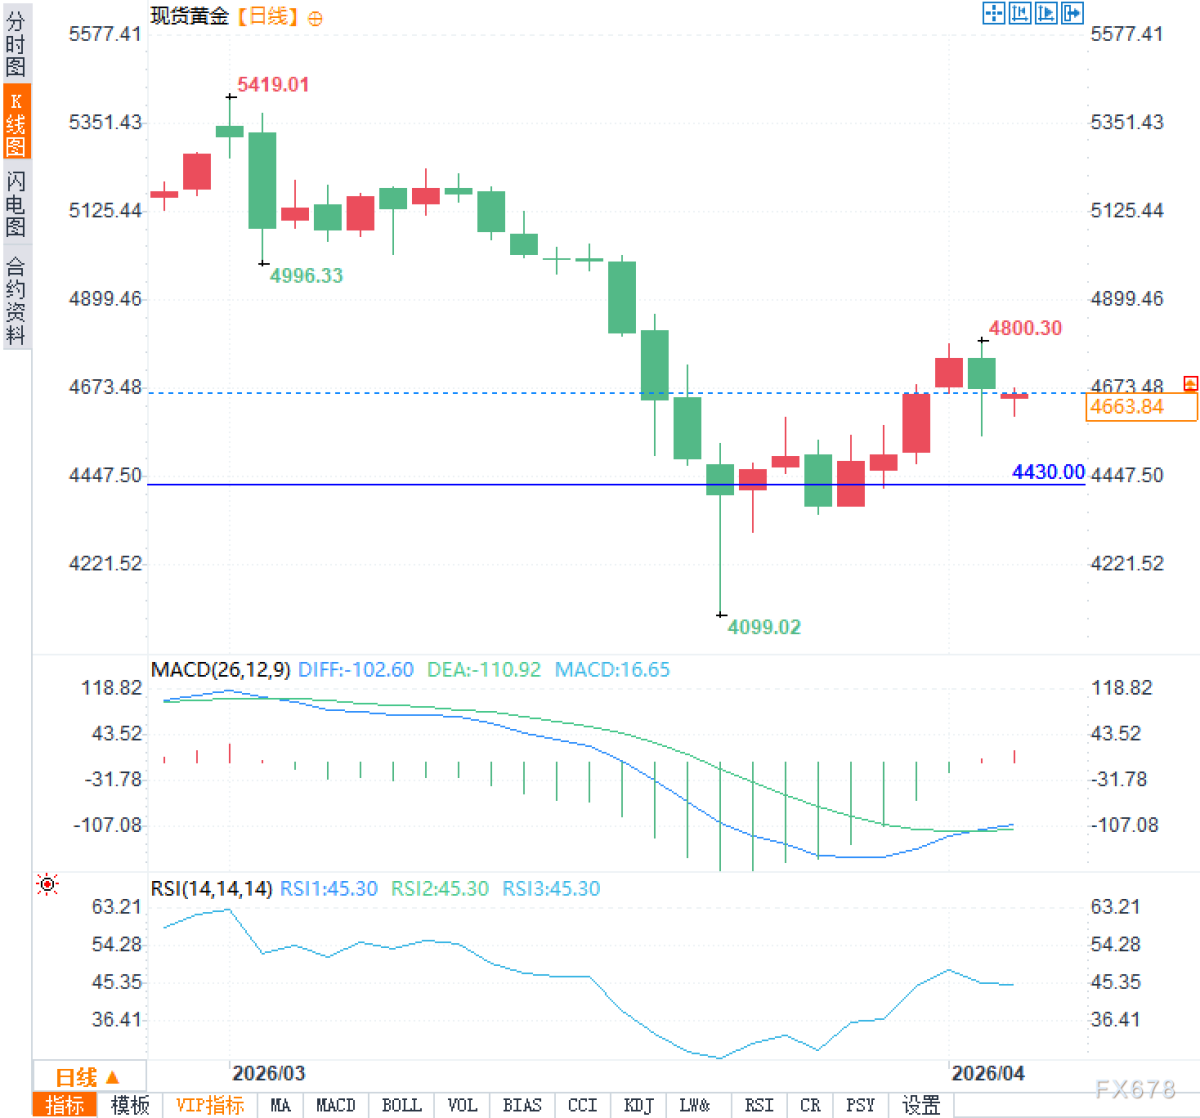
The current price is oscillating within the $4,650 to $4,700 per ounce range, with moderate trading volume, and the short-term moving average system showing entangled conditions. Traders are closely monitoring the boundary lines of the triangle, with a confirmed breakout accompanied by increased trading volume indicating direction. The tug-of-war between geopolitical risks and macroeconomic data is reflected through this technical structure, and any external catalyst could accelerate the breakout process.
Fed policy outlook constrains gold pricing space.
The Federal Reserve maintained the federal funds rate target range at 3.5% to 3.75% in March, with the dot plot showing only one expected rate cut by 2026. Strong employment data further reduced the likelihood of near-term easing, with market expectations converging around a ‘higher for longer’ interest rate environment.
This policy path directly raises the real yield on the U.S. dollar, weakening the attractiveness of gold as a non-interest-bearing asset. Traders continue to track the latest statements from Fed officials and inflation data, as any unexpected inflation signals would reinforce tightening expectations and further compress gold’s upside potential. Although geopolitical factors provide some cushion, the pricing logic dominated by macro policies currently prevails.
Frequently Asked Questions
Question One: What is the core impact of the March Non-Farm Payroll data on gold pricing?
Answer: Data showing an addition of 178,000 jobs and a drop in unemployment to 4.3%, far exceeding expectations, significantly lowers the probability of Fed rate cuts, boosting the dollar and yields. As a non-interest-bearing asset, gold’s opportunity cost rises, directly limiting its valuation space.
Question Two: What does the symmetrical triangle pattern imply for short-term trading?
Answer: This pattern reflects price compression and energy accumulation, often leading to directional moves after a breakout. Traders need to focus on valid boundary line breaks and confirmations via trading volume to capture potential trend reversals.


