Frontline (NYSE:FRO) Q1 Net Margin Strength Challenges Bearish Earnings Narratives

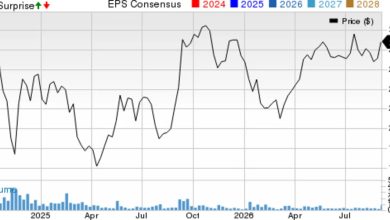
Frontline (NYSE:FRO) has come out of Q1 2026 with revenue of US$714.2 million and basic EPS of US$2.51, against a backdrop of strong trailing 12 month EPS of US$4.06 on revenue of US$2.3 billion. Over the past year, the company has seen quarterly revenue move from US$427.9 million in Q1 2025 to US$714.2 million in Q1 2026, while basic EPS shifted from US$0.15 to US$2.51. This sets up a results season where investors are likely to focus on how much of this earnings strength can be sustained. With trailing net margins already higher than the prior year and the share price at US$37.12, the latest report puts profitability front and center for anyone watching the stock.
See our full analysis for Frontline.
With the headline numbers on the table, the next step is to see how this earnings profile lines up against the widely followed narratives around Frontline’s growth potential, risk profile, and long term profitability story.
See what the community is saying about Frontline
Margins Run Hot With 40.2% Profit Share
- Over the last 12 months, Frontline converted US$2.3b of revenue into US$904.9 million of net income, which works out to a 40.2% net margin compared with 18.3% a year earlier.
- What stands out against the bearish narrative is that critics point to pressure on revenue and net margins from geopolitics and aging ships, yet trailing earnings grew very strongly, including a 160% rise over the last year and 24.2% average annual growth over five years, which is not what you would expect if shrinking margins were already taking hold.
- Bears highlight risks from higher operating and compliance costs, but the current 40.2% margin is more than double the 18.3% level cited for the prior year.
- They also flag tanker market volatility, while the latest trailing figures show net income of US$904.9 million against US$2.3b of revenue, which points to a business that has, so far, been able to keep a large share of each revenue dollar.
Frontline’s strong margin profile is exactly what optimists focus on when they argue the stock could still have room to run, even if forecasts cool off from here, and that tension between high current profitability and the cautious outlook is explored in more depth in the 🐂 Frontline Bull Case.
9.1x P/E Versus Peers On 160% Earnings Growth
- On the current share price of US$37.12, Frontline trades on a trailing P/E of 9.1x, compared with a peer average of 25.3x and a US Oil & Gas industry average of 14.6x, despite trailing earnings having risen 160% over the last year.
- Supporters of the bullish view argue that this valuation and the DCF fair value of US$99.60 imply the stock is pricing in far weaker conditions than recent results. Yet the same bullish narrative still builds in revenue declines of around 6.5% a year and relies on profit margins rising toward 55.8%, which is a stretch when the current trailing margin is 40.2%.
- The gap between the current price of US$37.12 and the DCF fair value of US$99.60 suggests the market is not paying much for the past 160% earnings growth.
- At the same time, even bullish assumptions point to top line contraction, so anyone leaning on the 9.1x P/E needs to be comfortable that higher future margins can offset declining revenue over time.
Forecast Declines Versus 24.2% Five Year Earnings Pace
- Analysts’ forecasts in the provided data call for revenue to decline around 15.2% per year and earnings to decline about 13.9% per year over the next three years, which is a clear contrast to the trailing 24.2% average annual earnings growth over the past five years.
- Skeptical investors point to this expected downturn, along with high debt and an unstable dividend record. Yet the consensus narrative still assumes earnings reach US$697.7 million by 2029 on revenue that is also set to decline and that the stock trades closer to an analyst price target of US$41.75, which indicates the cautious view is more about the path of earnings than about the current level of profitability.
- Consensus expects margins to move from 19.3% to 44.3% over three years, while the trailing 12 month margin is already 40.2%, so the step up implied is smaller than the headline suggests.
- With earnings forecast to decline from current trends despite that margin profile, the key question for a reader is whether the past five year earnings pace of 24.2% per year or the projected declines carry more weight for their own expectations.
Skeptics who see the forecast earnings declines and balance sheet risks as the bigger story than past growth may want to unpack how that cautious stance compares with the latest numbers in the 🐻 Frontline Bear Case.
Next Steps
To see how these results tie into long-term growth, risks, and valuation, check out the full range of community narratives for Frontline on Simply Wall St. Add the company to your watchlist or portfolio so you’ll be alerted when the story evolves.
With both risks and rewards in play, the real question is which side matters more for you right now. Move quickly, weigh the latest figures for yourself, and check the full breakdown of 3 key rewards and 3 important warning signs
See What Else Is Out There
Frontline faces tension between strong recent profitability and forecasts that point to declining revenue and earnings, along with concerns about debt levels and dividend stability.
If you want stocks where balance sheet strength directly addresses those concerns and supports more resilient cash flows, start comparing ideas using the solid balance sheet and fundamentals stocks screener (46 results) today.
This article by Simply Wall St is general in nature. We provide commentary based on historical data
and analyst forecasts only using an unbiased methodology and our articles are not intended to be financial advice. It does not constitute a recommendation to buy or sell any stock, and does not take account of your objectives, or your
financial situation. We aim to bring you long-term focused analysis driven by fundamental data.
Note that our analysis may not factor in the latest price-sensitive company announcements or qualitative material.
Simply Wall St has no position in any stocks mentioned.
New: AI Stock Screener & Alerts
Our new AI Stock Screener scans the market every day to uncover opportunities.
• Dividend Powerhouses (3%+ Yield)
• Undervalued Small Caps with Insider Buying
• High growth Tech and AI Companies
Or build your own from over 50 metrics.
Have feedback on this article? Concerned about the content? Get in touch with us directly. Alternatively, email editorial-team@simplywallst.com