Investors chasing global AI stocks must take note of earnings bubble
OpenAI and Anthropic are still cash burning AI labs
| Photo Credit:
Dado Ruvic
The RBI Bulletin released last week revealed an interesting factoid — that outward remittances by resident individuals for overseas investments reached $457 million in June — the highest ever. Given the scale and the lure of AI trade in overseas markets, it should be a safe guess that a good part of these remittances might have been channelled into AI themed bets in the US. Clearly, AI FOMO is keeping some Indian investors up at night.
After all FOMO can unnerve not just retail investors, but even large institutional investors. Take the case of GQG Capital which became famous amongst investors in India after buying into Adani Group stocks in 2023. Recently, the AMC made a complete about turn by going overweight on AI stocks after warning for around two years that AI stocks were in a mega bubble and publishing multiple reports titled calling AI bubble as ‘Dotcom on Steroids’. Its shares hitting three-year lows and investors pulling out around $15 billion from its funds due to underperformance after underweighting AI stocks in recent years could have been the last straw.
Other investors feeling the pull, must take note of some important data in this context.
The 2007 parallel
For most American banks and insurers in the first half of 2000s, 2006 was the peak year for earnings. In the four years between 2002 and 2006, the profit of the 10 largest financial stocks by earnings (as of 2006), grew at a staggering 24 per cent CAGR—and their combined earnings accounted for about 15 per cent of the aggregate profit of S&P 500 companies for 2006. These 2 per cent stocks (10/500) were worth about 11 per cent of S&P 500 companies’ market cap then. In the backdrop of loose regulations, banks had thrown caution to the wind and took on risky, leveraged bets in the US housing market. Based on analysis of historical data the entire financial system worked on an assumption that the property market will never fall across all sates in the country at the same time. Under this assumption, the risk to mortgage bonds was deemed manageable. But when this assumption was proved wrong in 2007, everything broke loose culminating in GFC.

Financials went from about 20 per cent weightage in S&P 500 at the peak before GFC (Oct 2007) to 11 per cent at the trough following the crash (March 2009). The combined earnings of top 10 financial companies declined from $118 billion in CY26 to losses adding up to $143 billion in CY28. Wachovia was folded into Wells Fargo.
Cut to today, the AI trade also shows signs of an earnings bubble — only larger in scale than 2007-08. The 10 largest AI-related companies of 2026 by earnings, are estimated to post a combined profit CAGR of a whopping 44 per cent for the four-year period ending CY26. The 2 per cent of companies this time, will likely account for about 30 per cent each of the index’s profit pool for CY26 and 30 per cent of its market-cap, respectively.

The dotcom parallel
Here is an interesting data to note. During the 2007 market peak, the PE of S&P 500 was just 17 times, yet the index fell by more that 50 per cent as the earnings bubble burst. Today, the S&P 500’s P/E multiple now stands at a 26x – valuation level that compares with valuation at the peak of dotcom bubble of 29 times. While in the event of any stumbling block in the AI theme, the earnings may not crash like it did for the financials in 2008, it is still likely to be significant given the scorching pace at which related capex has inflated earnings for semiconductor companies.
The Buffett indicator, too, is at a record high of 2.5x GDP now versus 1.3x before the GFC. It went close to 2x at the peak of the dotcom bubble.
Earnings becoming cashless
“How cash rich are the earnings?” In its results for Q2 FY27 (released last Wednesday), though Nvidia delivered a beat on earnings, its free cash flows came in a lot lower at $21.4 billion versus consensus estimate of $47.2 billion. In fact, Nvidia’s case is just an illustration of a deeper trend. Based on consensus estimates of net profit and free cash flows for 2026, the combined free cash flows of the said 10 AI stocks stand at a mere 30 per cent of their combined net profit. This ratio has significantly grown thin from about 80 per cent as of 2022 and around 100 per cent over 2018-22 on average.

Saddled with over $2.5 trillion in lease obligations (yet to commence) and purchase commitments for data centre gear, the prized cash flow machines of the tech boom since 2010 are making an 180-degree turn on cash generation.
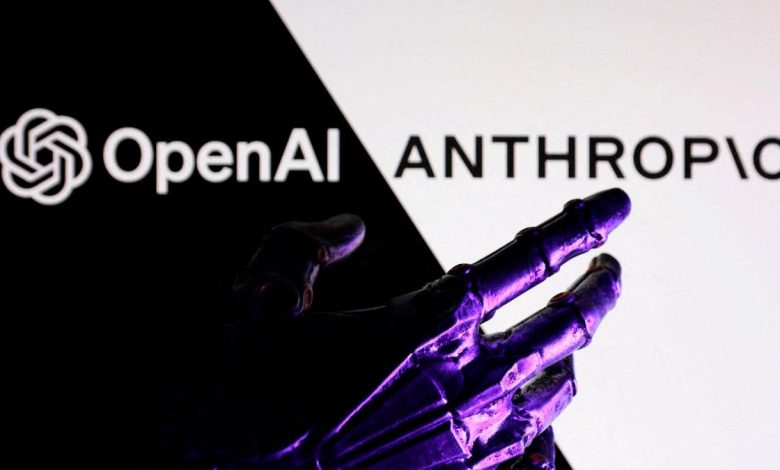
Further per a Barclays analysis, OpenAI and Anthropic, together constitute 73 per cent of Amazon’s AI revenue. Similarly, they make 69 per cent of Microsoft’s AI revenue, per a Wells Fargo report. OpenAI and Anthropic are still cash burning AI labs whose moats are increasingly under threat from cheaper open weight models. The two labs also comfortably make up over 40 per cent of the revenue backlog of the hyperscalers (see graphic). In what critics of the boom call as ‘circular financing’, Nvidia and the hyperscalers infuse cash into companies like OpenAI and Anthropic, with an expectation that the money finds its way back to them, in the form of orders for GPUs or contracts for compute.

Thus, while the trailing returns in AI stocks might be alluring, history has good enough lessons which if understood well will help investors not fall into the FOMO trap. An earnings bubble which is becoming more cashless amid a valuation bubble is not a difficult lesson to fathom.
Published on August 29, 2026