Bond Yields Flashing Historical Signal as SPY Sentiment Shifts

Last week’s slowdown isn’t a sell signal, because short-term trendlines held up
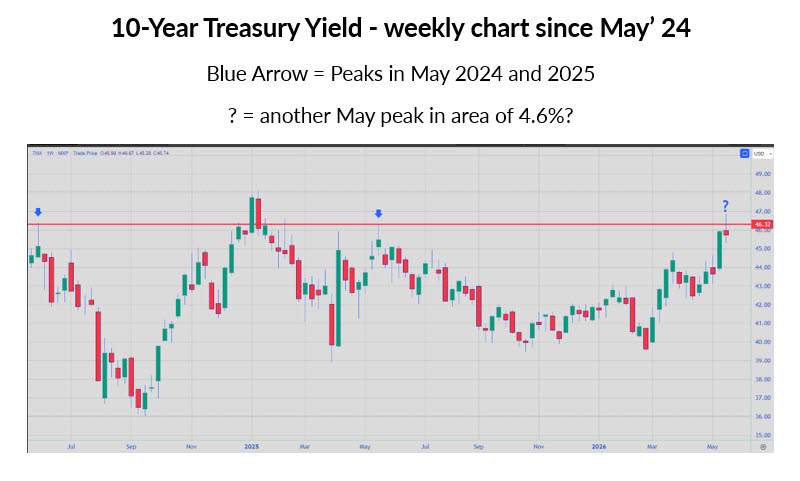
“The yield on the 10-year Treasury bond surged from 4.36% to nearly 4.6% during the week, with most of the damage being done on Friday, as the 10-year yield traded at its highest level since May 2025. For what it is worth, the 10-year peaked at 4.6% in May 2024 and May 2025 before pulling back by 100-basis points and 50-basis points, respectively. Might we see a third consecutive May peak in the 10-year yield at 4.6%?”
-Monday Morning Outlook, May 18, 2026
“The Federal Reserve Bank of New York’s Center for Microeconomic Data today released the April 2026 Survey of Consumer Expectations, which shows that households’ inflation expectations increased at the short-term horizon…”
-Federal Reserve Bank of New York, May 7, 2026
Unlike two weeks ago, the equity market did not have to fight headwinds from rising bond yields, particularly the 10-year Treasury yield. As such, stocks rallied as bond yields fell, which reminded me of an observation that I made in last week’s commentary. That is, in the past two years and in the month of May, the 10-year yield peaked in the vicinity of 4.6%.
Could we be on the verge of a notable peak in yields in the month of May for a third consecutive year? With a new Fed Chair sworn in on Friday, recent media stories talking about the destruction in the bond market as inflation expectations rise, a potential contrarian play is a repeat of May 2024 and May 2025, with respect to a shift from bearish price action in the bond market to bullish price action.
“A pause in the current momentum would not come as a major surprise, with option buyers showing extreme optimism – buying puts (downside bets or hedges) at a very low rate relative to calls (upside bets) on SPX component stocks….But a ‘sky is the limit’ sentiment landscape is not apparent in all sentiment indicators that we track…The implication is that the ‘buy the dip’ mentality that has been so prevalent could continue to be the mark of this bull market, whether it is momentum players at work, or shorts throwing in the towel and ultimately establishing a floor.”
– Monday Morning Outlook, May 18, 2026
If there is a peak in yields, the jury is out on what this might mean for stocks. On one hand, it could be the next tailwind takes the form of a broadening in the number of stocks participating in the rally, particularly small caps. This group retreated two weeks ago when yields rose.
Bigger picture, however, is stocks, including small caps, have rallied in the face of rising yields since late February. As such, a peak in yields could result in a shift into bonds as some market participants take profits on stocks. This is something we are watching as the S&P 500 Index (SPX—7,473.47) approaches potential resistance.
As I mentioned last week, one sentiment indicator we track – the ratio of put buying relative to call buying on SPX components – is showing extreme optimism. Given the market’s strong technical backdrop, my conclusion was that the implications of this extreme were minimal, but should be on your radar because it may only hint at a slow-down from the rocket trajectory stocks have displayed since the trough in late March.
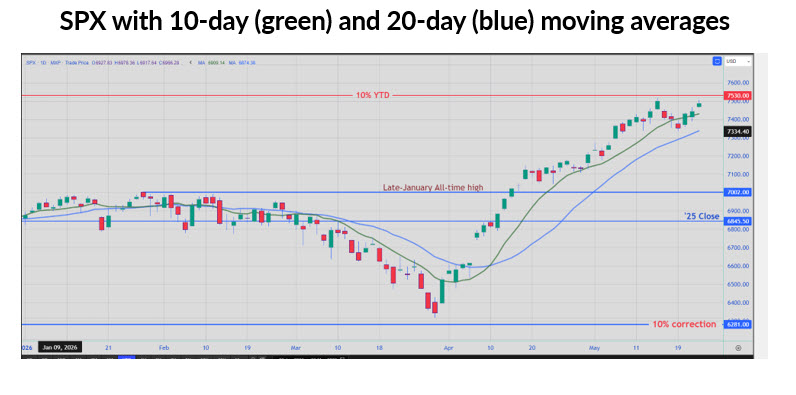
The SPX closed beneath its 10-day moving average last Tuesday for the first time since the bottom in late March, and the slope of this moving average is not as steep as two weeks ago. Therefore, one can conclude that momentum has slowed. But the slowdown isn’t necessarily a sell signal, as the close below the 10-day moving average lasted one day, with dip buyers noticeably and immediately present.
However, Friday’s high was in the vicinity of the prior week’s high just above 7,500. And the 7,530 level, which is 10% above last year’s close, is just overhead. The 7,500 – 7,530 zone could represent a hesitation area that marks a shift from momentum higher to a range environment or even a small pullback.
Even though option buyers on individual SPX component stocks have been extremely bullish, that is not the case among those trading S&P 500 ETF Trust (SPY—745.64) options.
Note that well after the SPY broke out above its January highs, the ratio of put buying to call buying on the SPY hit a one-year high at the end of April. The ratio is now rolling over, and still well above 1.0. In December, the ratio went below 1.0, and this marked the beginning of a trading range and then ultimately the March downturn.
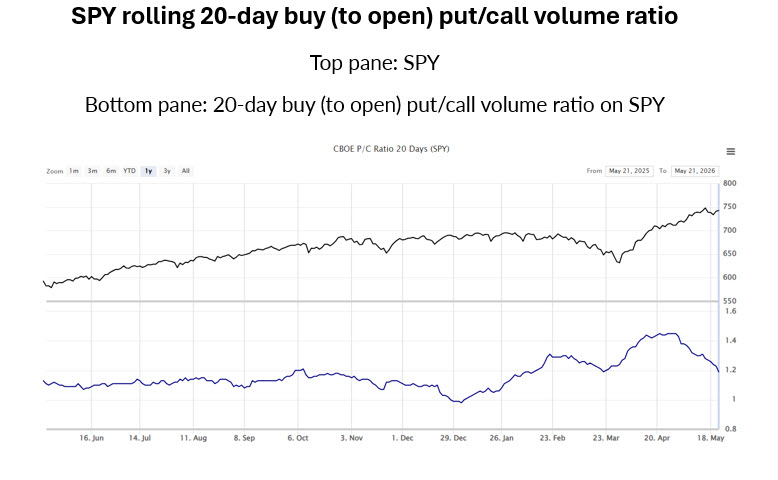
With call buying picking up on the SPY relative to put buying, this could be supportive day-to-day and contain pullbacks. But if this ratio moves closer to or below one, it will leave the SPY vulnerable to weakening price action if the recent past is prologue.
Finally, remember that this has been and continues to be a highly shorted market. As long as the technical backdrop is strong, this favors the bulls, as the short squeezes could keep momentum alive longer than anyone expects, while short covering could also provide a floor on pullbacks.
Looking ahead to next week, the 7,500-7,530 continues to be a potential resistance area. But note that last week’s low at 7,333 is just above the SPX’s rising 20-day moving average, which marks a potential support area between 7,300 and 7,330.
Todd Salamone is Schaeffer’s Senior V.P. of Research