E.ON (XTRA:EOAN) Valuation Check After Q1 2026 Earnings Boost Profitability

E.ON (XTRA:EOAN) has reported first quarter 2026 earnings, with sales of €22,895 million compared with €26,262 million a year earlier. Net income reached €2,230 million and basic EPS from continuing operations was €0.85.
See our latest analysis for E.ON.
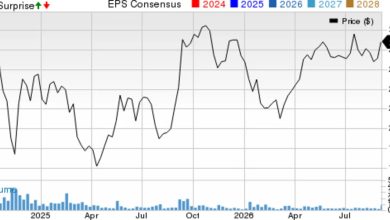
The 1-day share price return of 1.37% takes E.ON to €18.11, while the stock is still down 3.67% over 30 days but up 10.06% year to date, with a 1-year total shareholder return of 24.14% pointing to momentum that has built over the longer term.
If this earnings move has you thinking about the wider energy grid theme, it could be worth scanning 35 power grid technology and infrastructure stocks
With E.ON now trading at €18.11 and only a modest discount to analyst targets and intrinsic estimates, the key question is whether the recent earnings strength leaves upside on the table or if the market is already pricing in future growth.
Most Popular Narrative: 7.2% Undervalued
At €18.11, the most followed narrative sees E.ON trading below a fair value estimate of €19.51, with that gap grounded in detailed long term forecasts.
The industry’s secular transition toward deeper electrification (EVs, heat pumps, decentralized renewables) is structural and policy-supported at both EU and national levels, positioning E.ON to capture secular market expansion and supported by increasingly favorable government targets and subsidies, which should drive top-line and EBITDA growth.
Want to see what kind of revenue path and margin profile sit behind that fair value, plus how earnings are projected to compound over time? The full narrative spells out the growth rates, profit assumptions and valuation multiple that need to line up to justify €19.51 as a present value anchor.
Result: Fair Value of €19.51 (UNDERVALUED)
Have a read of the narrative in full and understand what’s behind the forecasts.
However, you still need to weigh regulatory shifts that could cap allowed returns, as well as higher, longer term grid capex that may pressure margins and free cash flow.
Find out about the key risks to this E.ON narrative.
Next Steps
Given the mix of optimism and concern running through this narrative, it makes sense to review the underlying data and decide quickly where you stand. Start with the 2 key rewards and 2 important warning signs.
Looking for more investment ideas?
If you stop with just one stock, you risk missing other opportunities that could fit your goals even better, so keep pushing your research a step further.
This article by Simply Wall St is general in nature. We provide commentary based on historical data
and analyst forecasts only using an unbiased methodology and our articles are not intended to be financial advice. It does not constitute a recommendation to buy or sell any stock, and does not take account of your objectives, or your
financial situation. We aim to bring you long-term focused analysis driven by fundamental data.
Note that our analysis may not factor in the latest price-sensitive company announcements or qualitative material.
Simply Wall St has no position in any stocks mentioned.
Valuation is complex, but we’re here to simplify it.
Discover if E.ON might be undervalued or overvalued with our detailed analysis, featuring fair value estimates, potential risks, dividends, insider trades, and its financial condition.
Have feedback on this article? Concerned about the content? Get in touch with us directly. Alternatively, email editorial-team@simplywallst.com