
Non-Farm Payrolls and ‘Terror Data’ Could Spark Volatility! FXStreet Chief Analyst Provides Technical Analysis of Gold Prices

#Gold Technical Analysis# According to a report by 24K99 on Tuesday (December 16), during the Asian trading session, spot gold experienced a short-term decline, with the current price hovering around USD 4,297 per ounce. Valeria Bednarik, Chief Analyst at FXStreet, authored an article analyzing the technical outlook for gold.
Bednarik noted that gold prices are near USD 4,300 per ounce. Market caution has resurfaced ahead of the release of initial U.S. economic data. The United States will release its November non-farm payroll report on Tuesday, which will include some data missing from October; the Consumer Price Index (CPI) will also be released on Thursday. These reports may influence market expectations regarding the Federal Reserve’s monetary policy trajectory for 2026.
In addition to U.S. data, several major central banks, including the European Central Bank, the Bank of England, and the Bank of Japan, will announce their monetary policy decisions this week.
During today’s trading session, investors will focus on the U.S. non-farm payroll report and retail sales data, which are expected to trigger significant market movements.
At 21:30 Beijing Time on Tuesday, the U.S. Bureau of Labor Statistics will release the non-farm payroll report covering October and November.
Due to the U.S. government shutdown, which lasted from October 1 to November 12, the underlying data for this non-farm payroll report could not be collected or traced. The U.S. Department of Labor has addressed this issue by consolidating October and November data, foregoing separate monthly releases.
Economists expect that the seasonally adjusted increase in non-farm payrolls for October-November will be 40,000, down from the previous figure of 119,000. The unemployment rate for October-November is forecasted to remain unchanged at 4.4%.
Analysis by the Financial Times points out that the upcoming U.S. non-farm payroll report, which will cover both October and November, will provide policymakers and investors with a more complete picture of the U.S. labor market, ending months of partial blind flying.
Following last week’s highly divisive meeting, the Federal Reserve cut interest rates to a three-year low. Several officials dissented, with debates centering on whether priority should be given to addressing high inflation or a weakening job market.
Economists at Citigroup noted that the upcoming employment report may send mixed signals. The bank forecasts a reduction of approximately 45,000 jobs in October, but an increase of 80,000 in November. Citigroup economists stated that this rebound might be more related to seasonal data adjustments rather than a “genuine improvement in labor demand.”
Derek Halpenny, an analyst at MUFG Bank, stated that given Federal Reserve Chairman Powell’s previous rationale for interest rate cuts primarily based on a weakening labor market, if the upcoming employment data this week shows weakness, the US dollar may face further selling pressure before the end of the year.
Marvin Loh, Senior Global Macro Strategist at State Street Global Advisors, stated that if the non-farm payroll data starts to turn negative, discussions about whether the economy is in a recession will become unavoidable, and expectations for Federal Reserve rate cuts will also intensify.
At 21:30 Beijing time on Tuesday, the US Census Bureau will release the October retail sales data.
Authoritative media surveys indicate that the US October retail sales month-over-month growth is expected to rise by 0.2%, following a 0.2% increase in September.
The US retail sales data, often referred to as the “terror data,” typically has a significant impact on financial markets and could therefore influence movements in assets such as the US dollar and gold.
Technical Outlook Analysis for Gold
Bednarik pointed out that from a technical perspective, the daily chart of gold shows upside risks for price movements. The 20-day Simple Moving Average (SMA) is above the 100-day and 200-day SMAs, with all three moving averages trending upwards, further reinforcing a bullish bias. The 20-day SMA is near $4,183.50 per ounce, providing short-term dynamic support. Meanwhile, technical indicators remain well above their respective midlines but have flattened, reflecting a temporary stagnation in gold demand.
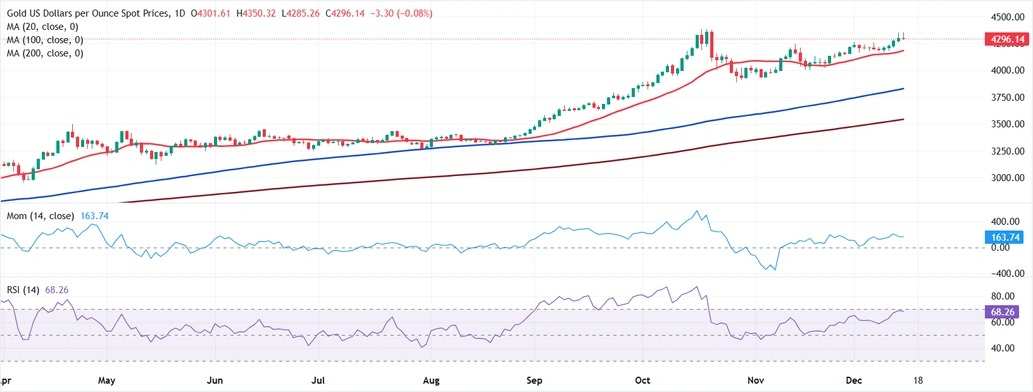
(Daily chart of spot gold, source: FXStreet)
Bednarik added that in the short term, based on the 4-hour chart of gold, there is a risk of further downward correction. However, the price remains above all moving averages: the 20-period SMA crosses above the 100-period and 200-period SMAs, offering immediate support around $4,280 per ounce.
Bednarik noted that, at the same time, momentum indicators show clear signs of weakness with a downward trajectory but remain above their midlines; the Relative Strength Index (RSI) stands at 55, also showing a downward trend. The Monday high of $4,350 per ounce acts as resistance, with another historical high resistance zone located around $4,380 per ounce.
At 10:53 Beijing time, spot gold was trading at $4,296.75 per ounce.


