US Government Sold $742 billion of Treasury Securities last Week. T-bill Yields now Below Surging Inflation. Bond Market Bets on Rate Hikes
The Fed is behind the curve, the bond market is saying, and it’s going to hike belatedly starting later this year, whether it wants to or not.
By Wolf Richter for WOLF STREET.
The US government sold $742 billion of Treasury securities last week, spread over 10 auctions. Of these auction sales, $504 billion were Treasury bills, with maturities from 4 weeks to 26 weeks, most or all of them to replace maturing T-bills, and $238 billion were notes with maturities from 2 years to 7 years.
There had been a bit of a lull of T-bill issuance during tax season as tax receipts were flooding into the government’s coffers, swelling up its checking account, the Treasury General Account (TGA), to over $1 trillion. In response, the Treasury Department had reduced its T-bill auction sales. But that’s over. The TGA balance has dropped back to $850 billion, below the desired balance of $900 billion, and T-bill issuance has resurged to January levels.
Inflation rates accelerated further in April, with the Fed-favored PCE price index at 3.8%, nearly double the Fed’s target, and the Consumer Price Index also at 3.8%. And T-bill yields, though they have edged up, are now below the rates of inflation across the board.
| Type | Auction date | Billion $ | High Rate | Investment Rate |
| Bills 4-week | May-28 | 88 | 3.63% | 3.69% |
| Bills 6-week | May-26 | 88 | 3.62% | 3.69% |
| Bills 8-week | May-28 | 83 | 3.62% | 3.69% |
| Bills 13-week | May-26 | 92 | 3.60% | 3.68% |
| Bills 17-week | May-27 | 72 | 3.63% | 3.73% |
| Bills 26-week | May-26 | 80 | 3.65% | 3.77% |
| Bills | 504 |
The Fed’s FOMC meeting on April 29, and the press conference that followed, showed a sharply split Fed with hawkish dissents on ending the FOMC’s statement’s “easing bias”; dissenters wanted to replace it with a statement that would give an equal chance of the next move being a rate cut or a rate hike. In their public speeches since then, Fed speakers have further shifted hawkish.
The government also sold $238 billion of Treasury notes, including a regular 2-year note with a fixed coupon payment, and a 2-year Floating Rate Note (FRN).
The 2-year FRNs were sold at a “spread” of 0.103%, same as a month ago. Investors who bought them get an interest rate that resets every week, based on the yield at which the most recent 13-week T-bills were sold at auction. Plus investors get this 0.103% “spread” (discount margin).
| Notes & Bonds | Auction date | Billion $ | Auction yield | Spread |
| Notes FRN 2-year | May-27 | 28 | 0.103% | |
| Notes 2-year | May-26 | 79 | 4.07% | |
| Notes 5-year | May-27 | 80 | 4.18% | |
| Notes 7-year | May-28 | 50 | 4.29% | |
| Notes & bonds | 238 |
Bond market counts on multiple rate hikes, whether the Fed wants to or not.
For example, the fixed-rate 2-year Treasury notes sold at a yield of 4.07%, the highest auction yield since February 2025, which was three rate cuts ago, when the Fed’s target range was still 4.25-4.50%, and the 2-year auction yield (4.169% at the time) was below the target range, implying future rate cuts, which came later in the year, three of them.
Now the Fed’s target range is down to 3.50-3.75%. And the 2-year auction yield was 4.07%, with buyers expecting at least two rate hikes in the first portion of the 2-year term.
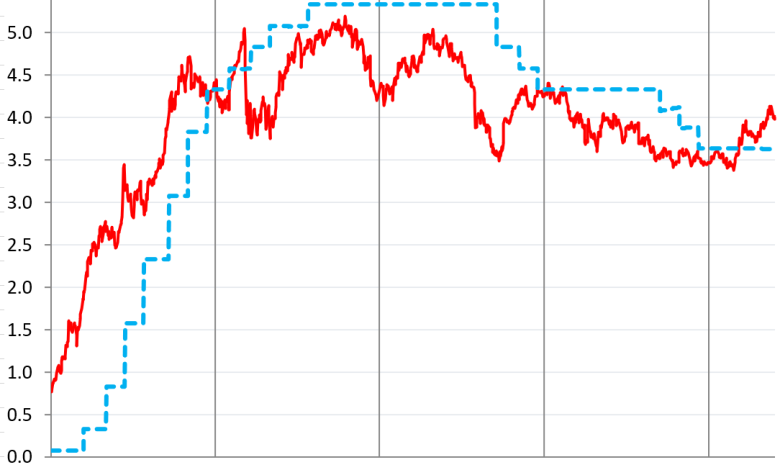
In the secondary market, the 2-year yield has been a good predictor of rate hikes and rate cuts. Late last year, it pivoted from more rate cuts to a hold. And in March it pivoted from hold to multiple rate hikes.
In the past week, the 2-year yield backtracked on the steep gains in the prior week and ended at 4.01%. The dotted blue line shows the Effective Federal Funds Rate (now at 3.63%), which the Fed targets with its policy rates.
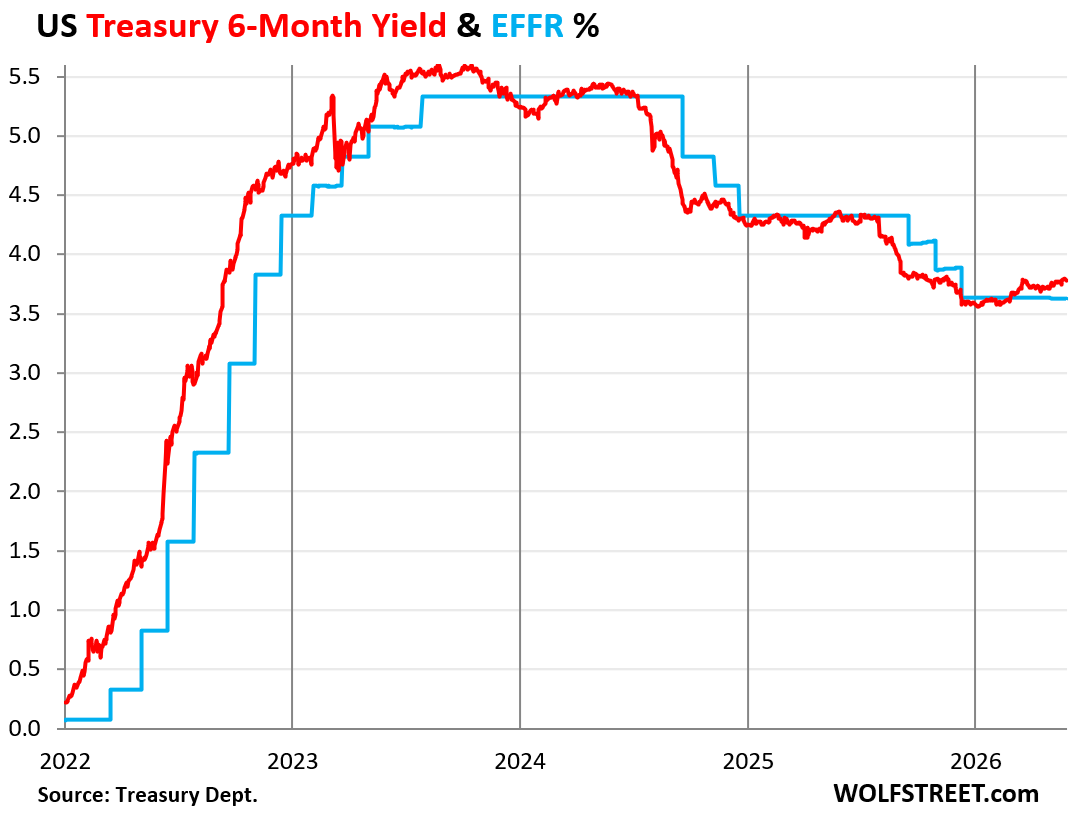
The 26-week (6-month) Treasury yield moved above the EFFR at the beginning of March and has been at around the upper end of the Fed’s target range (3.75%) since mid-March, showing that the bond market sees a substantial chance of a rate hike within four to five months – so later this year.
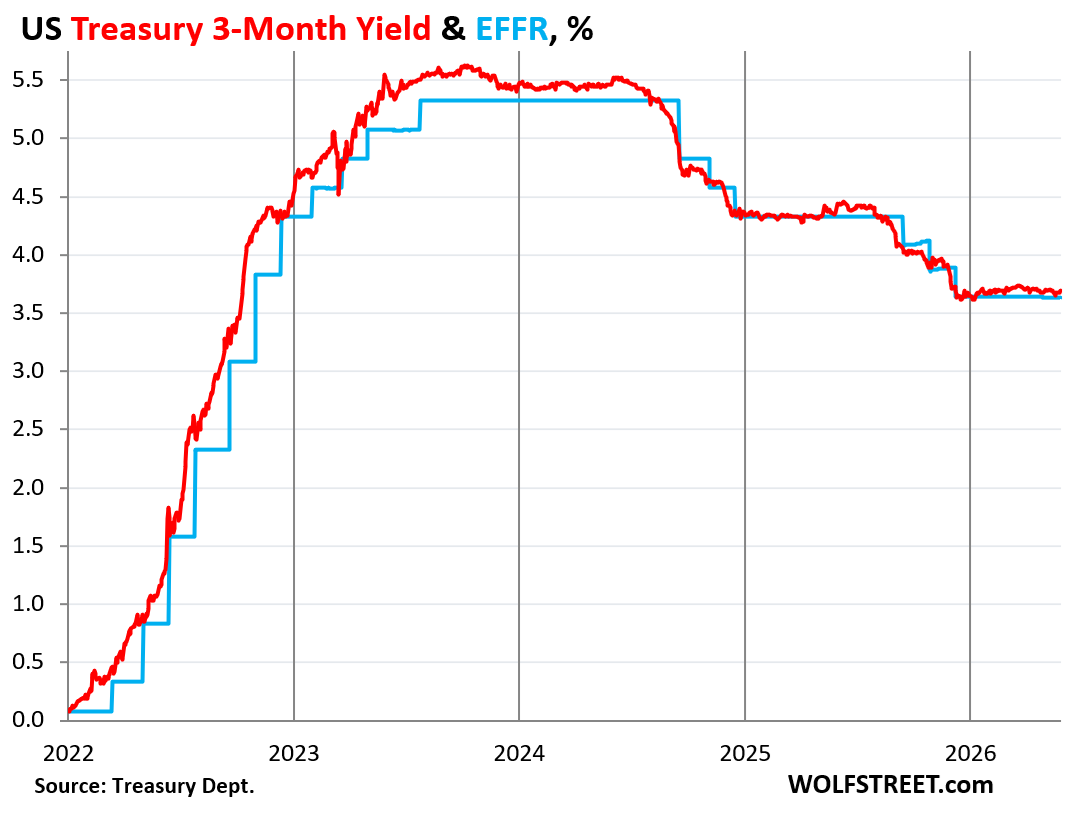
Rate hikes, yes, but not in June and July. The 3-month Treasury yield, which offers a good window of rate expectations in the first two months or so of its three-month window, has been near the middle of the Fed’s target range right at the EFFR, though it has come up a little from late last year and earlier this year.
So some hawkish talk at the June and July FOMC meetings, but no rate hike, they’ll have to wait till later this year, that’s what the bond market expects.
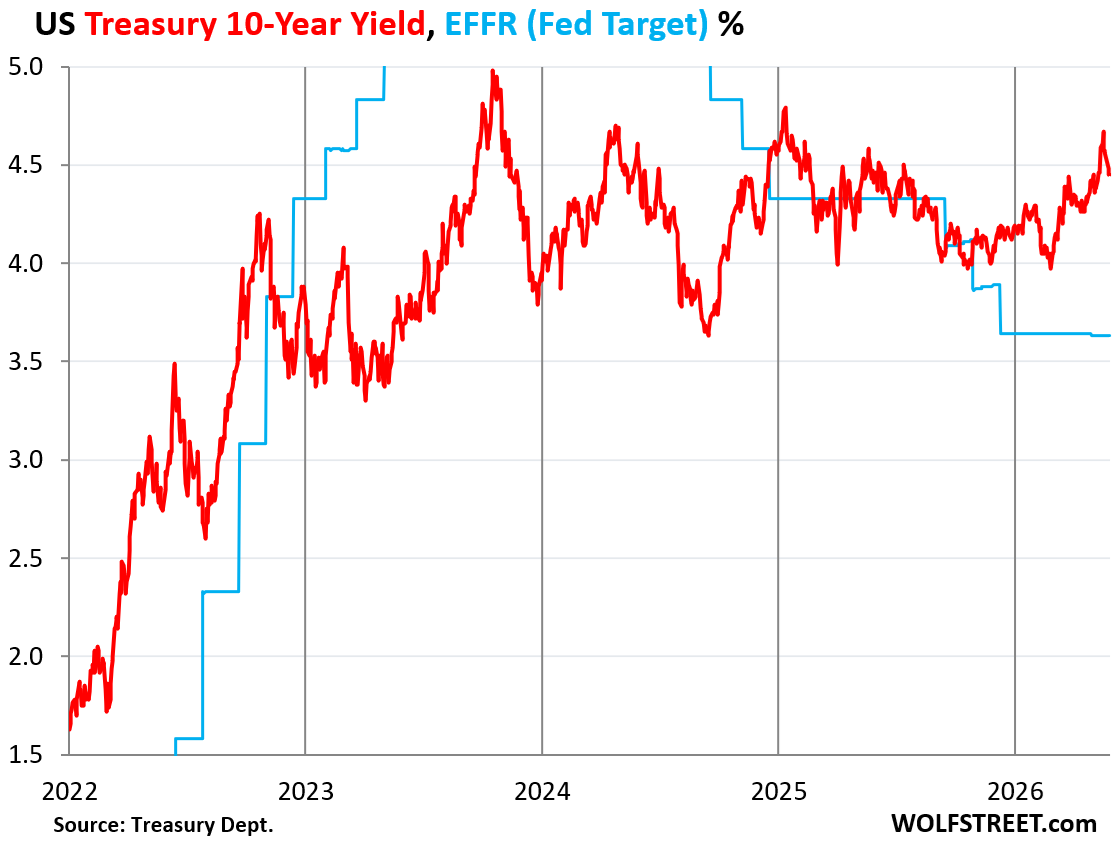
The 10-year Treasury yield declined by 11 basis points during the week and ended Friday at 4.45%, having backtracked on some of the prior increases, in the eternal bond-market yield-yo-yo.
For long-term debt, inflation can be devastating if the yield is too low and doesn’t compensate the holder for the loss of purchasing power plus some. And given the current inflation, and the Fed’s reluctance to deal with it, this yield indicates that the bond market is still delusional about inflation in the future.
Higher yields mean lower market prices for existing holders of longer-term securities, and that part of the bond market, a huge part of it, doesn’t want yields to rise; they want yields to fall to obtain higher market prices for their securities. That’s the direction they’re pushing. It’s only buyers that want higher yields (lower prices).
The longer end of the bond market has completely blown off the Fed’s rate cuts.
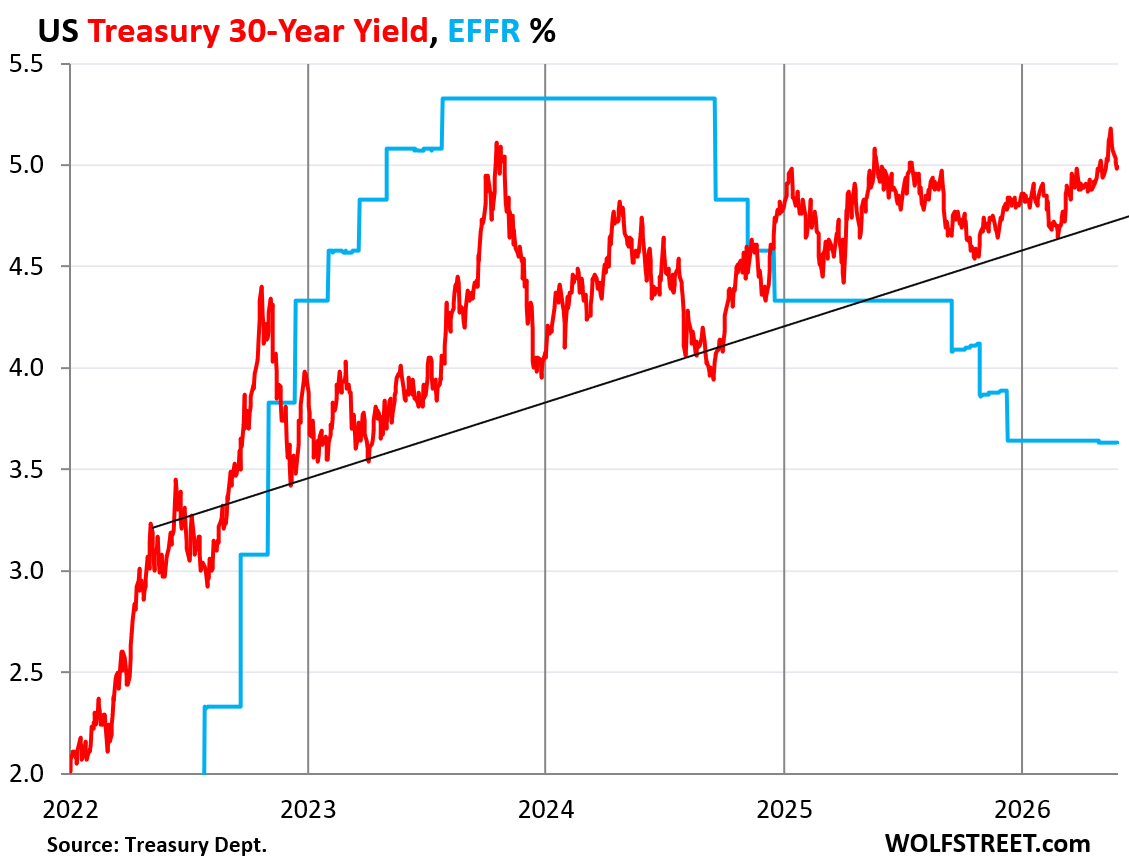
The 30-year Treasury yield has been dancing around the 5% line since early April, going as high as 5.18% two weeks ago, and then backtracking some. On Friday, it closed at 4.99%.
I drew this imaginary trend line that connects some of the lows: a five-year trend of higher lows, amid a narrowing of the yield-yo-yo as the bond market has been getting a little less uncertain about where this is going.
Enjoy reading WOLF STREET and want to support it? You can donate. I appreciate it immensely. Click on the mug to find out how: