Yagami (NSE:7488) Earnings Growth Of 22.1% Tests Income Focused Narratives

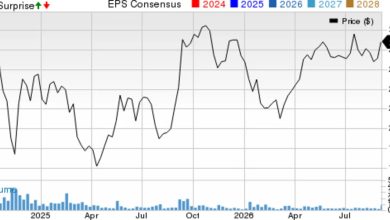
Yagami (NSE:7488) has just wrapped up FY 2026 with fourth quarter revenue of ¥3,156 million and basic EPS of ¥78.93, set against trailing twelve month revenue of ¥11,502 million and EPS of ¥302.75 that came with 22.1% earnings growth. Over recent periods the company has seen quarterly revenue range from ¥2,424 million to ¥3,156 million and basic EPS move between ¥61.96 and ¥84.27. This gives a clear line of sight on how the top and bottom line have tracked into this latest print. With a trailing net margin of 13.8%, the story now turns to how durable these margins look as investors weigh the balance between growth drivers and income potential.
See our full analysis for Yagami.
With the headline numbers on the table, the next step is to see how they line up against the prevailing narratives around Yagami, highlighting where the story is backed by the data and where expectations may need a reset.
Curious how numbers become stories that shape markets? Explore Community Narratives
22.1% earnings growth shifts the story
- Trailing 12 month earnings grew 22.1%, with basic EPS over that period at ¥302.75 and net income at ¥1,588 million on ¥11,502 million of revenue, so profitability and earnings growth are both anchored in the recent financials rather than just a single quarter.
- What supports a more bullish read is that this 22.1% growth is well above the 5.9% five year average. At the same time, the stock still trades on a 16.4x P/E, which heavily supports the bullish idea of a steady institutional supplier, although the high 5.71% dividend yield and its weak free cash flow cover mean income focused investors need to weigh that attractive yield against the cash strain it may create.
- Bulls arguing that Yagami is a defensive institutional supplier get some backing from the 13.8% net margin on the trailing 12 month revenue of ¥11,502 million, which lines up with the picture of a business selling essential equipment into education and healthcare settings.
- At the same time, critics of a pure bullish stance can point out that the 5.71% dividend yield is flagged as not well covered by free cash flow, so cash returns to shareholders depend heavily on the company maintaining current earnings and cash generation.
Margins sit at 13.8% after steady revenue base
- Across FY 2026, quarterly revenue ranged between ¥2,424 million and ¥3,156 million, and with trailing 12 month net income of ¥1,588 million on ¥11,502 million of revenue, Yagami is running at a 13.8% net margin compared with 12% a year earlier, which anchors the discussion around how much profit it keeps from each yen of sales.
- What is interesting for a bullish style narrative is that this margin profile fits the idea of a stable supplier into schools, labs, and healthcare facilities. However, the quarterly pattern, from ¥2,424 million in Q1 2026 revenue to ¥3,156 million in Q4 2026, means anyone leaning bullish still has to check that this level of profitability is supported across different periods rather than assuming a straight line trend.
- Supporters of the bullish case can point to basic EPS running between ¥61.96 and ¥84.27 in FY 2026 quarters and trailing EPS of ¥302.75 as evidence that the earnings base is not tied to a single strong period.
- On the other hand, those who are cautious can highlight that even with a 13.8% net margin, the dividend is not well covered by free cash flow, so profitability and cash conversion need to be watched together rather than separately.
To see how community narratives interpret this mix of margin strength, revenue stability, and dividend risk, check out the Curious how numbers become stories that shape markets? Explore Community Narratives.
P/E at 16.4x versus 29x peers
- Yagami trades at ¥4,970 per share on a 16.4x P/E, compared with a peer average of 29x and a JP Healthcare industry average of 13.4x, while the stock also sits about 1.1% below a ¥5,026.96 DCF fair value, which together frame how the market is currently pricing that earnings base.
- From a bullish angle, some investors may argue that a 16.4x P/E with 22.1% trailing earnings growth looks undemanding versus peers on 29x. However, the fact that the stock is priced above the 13.4x industry average and close to its DCF fair value means the bullish argument has to rest on earnings quality and consistency, not on a deep discount.
- Supporters of the bullish view can point to the assessment of high quality past earnings alongside the 22.1% growth, which helps explain why the stock does not trade at the lower industry P/E multiple of 13.4x.
- Investors who are more cautious can reasonably say that, with the share price only slightly below the ¥5,026.96 DCF fair value and ahead of the industry P/E, there is less room for error if earnings or cash flows soften from current levels.
Next Steps
Don’t just look at this quarter; the real story is in the long-term trend. We’ve done an in-depth analysis on Yagami’s growth and its valuation to see if today’s price is a bargain. Add the company to your watchlist or portfolio now so you don’t miss the next big move.
Seeing both risks and rewards in this story. Use the data, pressure test the narratives, and check the underlying details behind those 2 key rewards and 1 important warning sign.
See What Else Is Out There
Yagami’s high 5.71% dividend yield is not well covered by free cash flow, so income investors face real questions about how dependable those payouts are.
If you want income that looks better supported by underlying cash generation, compare this profile with the 45 dividend fortresses while the opportunity set is still fresh in mind.
This article by Simply Wall St is general in nature. We provide commentary based on historical data
and analyst forecasts only using an unbiased methodology and our articles are not intended to be financial advice. It does not constitute a recommendation to buy or sell any stock, and does not take account of your objectives, or your
financial situation. We aim to bring you long-term focused analysis driven by fundamental data.
Note that our analysis may not factor in the latest price-sensitive company announcements or qualitative material.
Simply Wall St has no position in any stocks mentioned.
New: Manage All Your Stock Portfolios in One Place
We’ve created the ultimate portfolio companion for stock investors, and it’s free.
• Connect an unlimited number of Portfolios and see your total in one currency
• Be alerted to new Warning Signs or Risks via email or mobile
• Track the Fair Value of your stocks
Have feedback on this article? Concerned about the content? Get in touch with us directly. Alternatively, email editorial-team@simplywallst.com