July supply slips nearly 20% but still above 10-year average
Processing Content
Supply dropped in July as the Federal Open Market Committee meeting-induced fall in weekly supply and the end of the fiscal year for some states led to a slowdown. Despite this, issuance was still one of the largest supply figures for July.
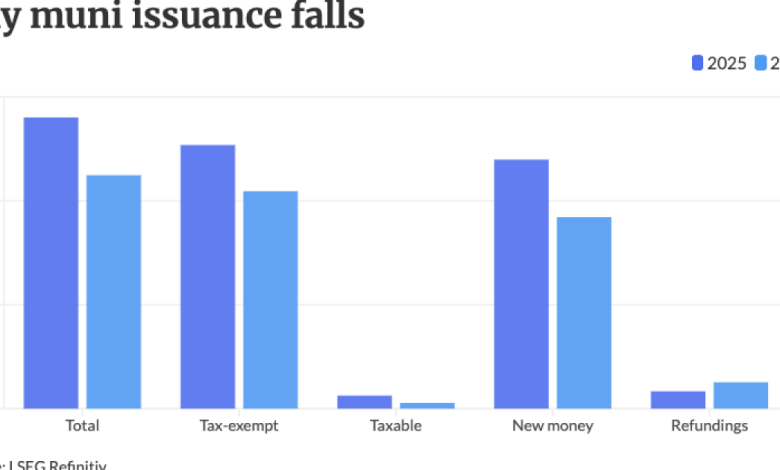
Issuance was $44.928 billion in 694 deals, down 19.8% year-over-year from $56.055 billion across 860 transactions.
Supply, though, was above the 10-year average of $36.702 billion and the third-highest supply figure for the month of July, bested only by 2025’s $56.055 billion and 2020’s $47.782 billion.
Supply year-to-date is at $342.799 billion, essentially flat year-over-year, rising only 0.7%.
Timing contributed to the fall in issuance, said Giles Nicholson, senior managing director and head of the Public Finance Quantitative Solutions Group at Siebert Williams Shank.
The first full three weeks of July saw supply range from $11.18 billion to $12.65 billion, but issuance during the final week of the month — because of the FOMC meeting — fell to $6.36 billion from the year’s weekly average of $11.058 billion, according to LSEG.
And because of the July FOMC meeting, some of that issuance was pushed into August.
Another potential factor was the June 30 fiscal yearend for some states, said Pat Luby, head of municipal strategy at CreditSights.
Issuing during July could create a “big distraction” for states and issuers, as they are working to close their books, he said.
July issuance was not greatly impacted by the large rate selloff in July, especially the week of July 20, Nicholson said.
Furthermore, not many deals in July were pulled, downsized or moved to the day-to-day calendar, he said.
Even with the fall in issuance, “when you consider the rate volatility that happened, especially the second half of the month, issuers were able to come and not that many deals got hung up, [which] speaks to the better fundamentals there,” said Kim Olsan, senior fixed income portfolio manager at NewSquare Capital.
The $44.9 billion figure is not that far off from CreditSight’s projected $50 billion supply figure for the month, Luby said.
While it’s behind a little bit, supply year-to-date is still on pace to hit the record-breaking $600 billion figure many strategists forecasted in their issuance projects, he said.
July details
Tax-exempt issuance fell 17.5% to $41.859 billion in 648 issues from $50.754 billion in 791 issues a year ago. Taxable issuance decreased 55.8% to $1.115 billion in 37 issues from $2.521 billion in 60 issues in 2025. AMT issuance was $1.955 billion, down 29.7% from $2.78 billion in July 2025.
New-money issuance fell to $36.873 billion from $47.943 billion, down 23.1%, while refundings rose 51.6% to $5.084 billion from $3.354 billion.
Revenue bond issuance ticked up 1.1% to $34.13 billion from $33.745 billion in July 2025, and general obligation bond sales declined 51.6% to $10.799 billion from $22.31 billion in 2025.
Negotiated deal volume was down 17.3% to $36.439 billion from $44.083 billion a year prior. Competitive sales fell 25.8% to $8.361 billion from $11.27 billion in 2025.
Deals wrapped with bond insurance decreased 33.6% to $2.408 billion from $3.626 billion.
Bank-qualified issuance was down 9.3% to $691.7 million in 166 deals from $763 million in 192 deals a year prior.
California claimed the top spot year-to-date among states.
Issuers in the Golden State accounted for $52.439 billion, up 0.8% year-over-year. Texas was second with $41.009 billion, down 7.4%. New York was third with $33.021 billion, down 11.8%, followed by Florida in fourth with $14.331 billion, up 10.5%, and Massachusetts in fifth with $13.833 billion, a 36.6% increase from the same period in 2025.
Rounding out the top 10: Alabama with $13.622 billion, up 106.4%; Pennsylvania with $11.372 billion, up 11.2%; Illinois with $9.035 billion, up 12.2%; Washington with $8.771 billion, down 3.1%; and Connecticut with $8.011 billion, up 110.9%.