A Nationwide Shift of Assets Behind the Stock Market, Bond Market, and Inflation

The sharpest operator will never show up on the Forbes list.
He runs the largest portfolio in the world, and every time he rebalances, he quietly alters the wealth trajectory of billions of people. Over the past eighty years he has almost never truly blown up, and no one has ever successfully forced him into default. More importantly, whenever he reallocates assets, it is always someone else who pays the price.
This operator is the United States government.
For more than a decade, “risk parity” has been repeatedly discussed among institutions and in financial circles: do not put all your eggs in one basket; let different assets hedge each other in different economic environments; do not demand profits in every short period, but aim not to be killed in any single storm. The key ideas are diversification and rebalancing.
If you move this concept up to the level of a nation, you will see another, more hidden kind of risk parity:
Under debt pressure, the US government is not simply thinking, “How do I repay this money?” Instead, it constantly reallocates, across different groups, who will bear this portion of the debt cost for it. Sometimes it is holders of Treasuries, sometimes depositors in the banking system, and sometimes ordinary wage earners with almost no financial assets. The techniques differ in each round, but the underlying logic is highly consistent: use institutions and policies to quietly rebalance the entire national balance sheet.
Once you understand the logic of this nation‑level asset allocation, many common‑sense views you hold about your own cash, bonds, stocks, and gold suddenly become much less obvious.
First lay out a table: the sovereign balance sheet
Before entering history, let us first build a framework for thinking.
We usually think of the government budget as a running cash book: collect taxes, then spend; if that is not enough, borrow. But if you look at a sovereign country in the language of a balance sheet, the structure is much more complex, and this level of complexity directly determines what tools the government has under debt pressure.
On the asset side, you can roughly break it into four items:
First, the tax base.
That is, the ability of the people to keep paying taxes over the coming decades. This is the core and most solid asset of any government, and it is the fundamental support that allows its sovereign bonds to be accepted by the market.
Second, natural resources and land.
These are limited in quantity but have huge implicit value, especially when they can be pledged, sold, or monetized through concessions.
Third, state‑owned assets.
These include state‑owned enterprises, infrastructure, and sovereign wealth funds. In the US this part is not very explicit, but it still exists.
The fourth item is also the most special one: the right to issue currency.
Strictly speaking, this is not an asset that appears on the balance sheet, but a basic power written into the American system. In extreme cases, it has almost no nominal upper limit and can create any scale of dollar liquidity out of nothing; the price is to use the dollar’s own credit as collateral and gradually draw on the future.
On the liability side, there are at least four blocks:
First, explicit sovereign debt—this is the part everyone is most familiar with.
Second, various implicit promises—long‑term welfare promises such as Social Security, pensions, and medical insurance, whose total amount often exceeds the book value of sovereign debt by several times.
Third, implicit guarantees to the financial system—whenever banks or key financial institutions run into systemic risk, the government finds it very hard to truly stand by and do nothing. This implicit “I may have to rescue you” obligation is also a real liability.
Fourth, the debt of local governments and quasi‑public sectors. Strictly speaking, not all of this counts as federal government liabilities, but in a major crisis it often ends up consolidated onto the same balance sheet.
In almost any era, there is a gradually tightening contradiction between the two sides:
Liabilities naturally tend to expand; political demands, election cycles, and population aging all push them upward. The growth of the asset side, however, is constrained by demographics, productivity, and political reality, and cannot always sprint ahead.
So every once in a while, this balance sheet is pushed to a critical point where new tricks must be invented.
What then?
Three historical toolkits: three acts of nation‑level rebalancing
Over nearly the past eighty years, the US has roughly used three completely different solutions. Each one amounts to a round of nation‑level rebalancing: redefining who truly bears the debt and who benefits relatively, and fundamentally changing the winners and losers across asset classes.
If you see these three acts clearly, you will notice:
In asset allocation, the most important question has never been simply what will go up, but: which move is the nation using this time to resolve its own debt, and on whom is the cost quietly falling?
First method: 1946–1971 — using inflation as a scalpel
In 1946, just after World War II, the US federal‑debt‑to‑GDP ratio was around 110 percent, a level that would not be in the safe zone in any ratings report. It accurately reflected a country that had just fought the most expensive war in history and was carrying a heavy bill.
Then something that pleased many economists happened:
By the mid‑ to late‑1970s, this ratio had already dropped to under 40 percent, nearly two‑thirds below its post‑war peak. Throughout this process, the US never once declared sovereign default, never adopted the kind of dramatic Greek‑style fiscal tightening seen in the eurozone crisis, and Treasury investors received every coupon and principal payment as agreed.
Source: Econofact
According to standard textbooks, the explanation is post‑war rapid economic growth. Industrial expansion, consumption upgrading, the baby boom, and technological progress all pushed up the nominal GDP denominator, so debt naturally looked less striking relative to the economic size.
This explanation is only half correct.
Take IMF work and subsequent research as examples: if you only rely on post‑war growth and primary fiscal surpluses, a debt ratio of over 100% of GDP at the peak would at best be diluted to the seventy‑something percent range, not down to the later low levels actually observed. Growth and fiscal restraint indeed contributed a lot, but at most explain about one‑third of the deleveraging. The bulk was shaved away by two silent blades.
The first blade was interest‑rate repression.
Starting in 1942, the Fed and the Treasury set yield caps for different maturities of Treasuries, with the target yield on long‑term bonds of 25 years and longer pinned at about 2.5 percent, and this framework continued until the 1951 Fed–Treasury Accord. During those roughly ten years, whenever long‑term yields neared the cap, the Fed stepped in to buy and push them back down. For the government, this was equivalent to locking borrowing costs at a very low level, enabling it to roll over a huge stock of debt with very light interest expenses.
The second blade was inflation.
After wartime price controls were lifted, pent‑up demand was released. In 1947, US CPI inflation briefly surged to nearly 20 percent year‑on‑year, and in the first post‑war years average inflation stayed in mid‑ to high‑single digits, even double digits. With long‑term nominal rates capped around 2.5 percent, real rates remained deeply negative, roughly in the minus‑3‑to‑minus‑5‑percent range.
If you lent money to the US government, you got 2.5 percent interest on paper every year, in full nominal terms. But after subtracting inflation, the real purchasing power of that money receded year after year.
Harvard economist Carmen Reinhart and others later systematized this mechanism and called it financial repression: there is no need for anyone to openly repudiate debt; through institutional arrangements that hold nominal rates below real levels, creditors quietly bear the cost of the state’s debt reduction.
Gold locked inside a cage
To understand why this surgery could be performed so smoothly, there is another often overlooked detail: the escape hatch had been welded shut.
Intuitively, if inflation is eroding money’s purchasing power, savers and Treasury holders should rush to buy gold to preserve value. But under Bretton Woods, the official price of gold was fixed at 35 dollars per ounce, the dollar was pegged to gold, and other major currencies were pegged to the dollar, creating a taut global monetary net.
The result was that even when inflation had quietly eroded the dollar’s real purchasing power, gold’s nominal price did not move. If you wanted to hide in gold from inflation, you faced a door welded shut: official prices were fixed, capital controls were in place, and ordinary people had almost no free channels to exchange into gold.
With interest rates pressed down and gold pressed down, truly safe exits were blocked. Savers and bondholders could only stay trapped in a negative real‑rate environment and watch their purchasing power slowly flow away.
From the perspective of the sovereign balance sheet, this is the core of the first nation‑level allocation:
Use institutions to control the price of money and the main safe‑haven asset, let inflation do most of the debt reduction, and shift the cost specifically to those who lent to the government, banks, and other institutions—holders of Treasuries, bank deposits, and various fixed‑income products, including both savers and institutional investors.
Second method: 1971–1982 — when the old game collapses, chaos first, then clearing
Anything that has been suppressed for too long will explode sooner or later. Gold was no exception.
First phase: system breakdown and violent repricing
On Sunday night, 15 August 1971, American households were watching the TV series “Bonanza” when the broadcast was suddenly cut. Nixon appeared on screen and announced that the US would stop converting dollars into gold at the official price of 35 dollars per ounce. Bretton Woods formally ended.
On the surface, the reason was to fight international speculators and protect the dollar. The real reason was much simpler: years of fiscal deficits, the Vietnam War, and welfare spending had left US gold reserves unable to meet the world’s continuous demand to swap dollars for gold.
Once gold was unpegged, the price cage was removed and decades of suppressed tension were instantly released. Starting from the official 35‑dollar level, gold went through two oil crises and a high‑inflation shock in the 1970s and by early 1980 briefly climbed above 800 dollars per ounce—a more than twenty‑fold increase in under ten years. Many people treat this as the great gold bull market of the inflation era, but more precisely, it was several years of compensatory repricing for decades of systematically depressed real prices.
At the same time, US stock investors suffered another kind of chronic torture. From 1966 to 1982 the Dow Jones index almost moved sideways in nominal terms, but under the erosion of high inflation its real return was deeply negative. The numbers barely changed, but the actual purchasing power in your wallet was hollowed out bit by bit—this is a classic case of “apparently not losing money, actually losing all the time”.
From the sovereign‑balance‑sheet perspective, this was the first phase of the second method:
When the old rules can no longer be sustained, simply dismantle the existing anchor, reset the monetary system, and use violent price repricing to complete a redistribution of debt. The prices of long‑suppressed real assets were released, and those who truly paid for this repricing were the people holding paper claims:
Those who bought long‑term Treasuries, CDs, and other fixed‑income products expecting to collect coupons while lying down found in the end that nominal interest could not catch up with the loss of purchasing power under high inflation and currency depreciation.
Those ordinary investors and wage earners who held US stocks for the long term but whose pay rises did not keep pace with prices quietly lost a large share of real wealth in those flat years.
In contrast, those who had been unable to get gold’s price to reflect its real value in the previous period but insisted on holding gold and other real assets finally received a compensatory return in the few years after the delinking.
Second phase: Volcker steps in and shoves inflation back into its cage
Once unleashed, the beast of inflation is hard to tame on its own. By the late 1970s, US inflation was completely out of control: CPI in 1979–1980 reached around 13 percent at its peak, inflation expectations were deeply embedded, and the dollar’s credibility was on the verge of collapse.
Carter appointed Paul Volcker as Fed chair and gave him an almost impossible mission: bring inflation down, no matter the cost.
Volcker chose a path that was close to political suicide: he pushed the federal funds rate from 11 percent all the way to nearly 20 percent by 1981. Unemployment jumped to double digits, the economy quickly sank into a deep recession, members of Congress cursed him in hearings, and farmers drove tractors to the Fed’s doors in protest. He kept moving along his own path under immense pressure.
The result was that inflation fell to about 3 percent within a few years, real rates turned clearly positive again, the dollar’s credibility was rebuilt, and bonds once more became assets with genuine returns.
In terms of asset prices, gold peaked in 1980 and then entered a bear market that lasted nearly twenty years, only forming a bottom around 250 dollars before 2000. US stocks began a long bull market from 1982; for nearly eighteen years afterwards, major indices delivered annualized nominal returns in the low‑ to mid‑teens.
If the early 1970s were the chaotic repricing caused by the breakdown of the old order, then Volcker’s move, after the chaos, was an extremely painful clearing that rebuilt the foundations for the long bull market in financial assets over the following decades.
From the perspective of nation‑level asset allocation, the full picture of the second method is:
First, let the monetary system lose its anchor and let prices reshuffle across the board so that previously squeezed real‑asset prices can be released and compensated. Then, use high real interest rates and harsh monetary tightening to push inflation back into its cage and hand the stage back to long‑term financial assets.
In the first half, those who held gold, resources, property, and other real assets benefited relatively, while those holding cash, bonds, and long‑term wage income paid the price in high inflation. In the second half, as real rates turned positive and inflation came under control, long‑term investors in quality equities and bonds became the new beneficiaries.
Third method: 2008–2022 — using asset prices to sustain confidence
After Volcker, the US enjoyed almost twenty calm years: the dividends of globalization, technological revolutions, and low inflation kept debt issues out of focus for a long time.
Until 2008.
This time, the starting point of the crisis was not direct government borrowing, but leverage inside the financial system spinning out of control: the housing bubble burst, complex structured products were layered through banks and investors, and once subprime defaults erupted, the entire credit system nearly froze. The Fed quickly cut policy rates to near zero, only to find that traditional tools were not enough.
So a set of tools never before used on such a scale was brought out: quantitative easing (QE).
The Fed directly entered the market to buy Treasuries and mortgage‑backed securities, using its own balance sheet as a sponge to absorb risk assets and long‑term bonds and inject liquidity into the system.
According to the data, at the end of 2007 the Fed’s total assets were under 1 trillion dollars; after three rounds of QE this number rose to about 4.5 trillion; during the 2020 pandemic shock it almost doubled again in a few months to nearly 9 trillion.
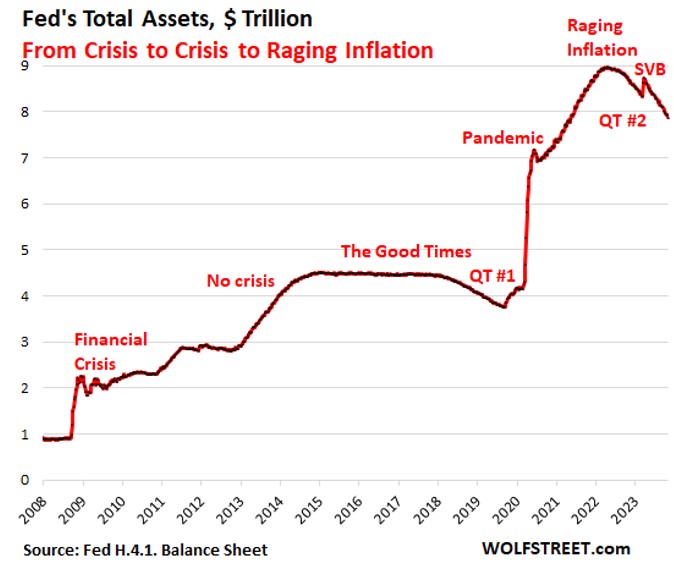
Source: Wolf Street
This technique had a subtle but fundamental difference from post‑war financial repression:
· Post‑war rate caps allowed inflation to quietly eat away at the real value of debt, with savers holding Treasuries and cash paying the hidden tax.
· After 2008, QE was more like a refined rebalancing: on one hand it suppressed overall interest rates so the government could roll over debt at low cost; on the other, it pushed up financial‑asset prices, making asset holders feel richer, thereby supporting consumption and the tax base.
For a long time, nominal rates were held very low, real rates repeatedly slipped into negative territory, and investors had to keep climbing the risk ladder in search of returns: stocks, real estate, high‑yield bonds, private equity, growth tech stocks—all were lifted by the flood of liquidity.
From the sovereign‑balance‑sheet perspective, this was a third form of nation‑level risk parity: support confidence by inflating financial‑asset valuations, spread the average cost of inflation across all consumers, and concentrate wealth gains in the hands of asset holders.
Gold clearly benefited in this act as well: around the start of QE1 it was still near 800 dollars per ounce, reached over 1,900 around 2011, and during the 2020 pandemic and the new wave of balance‑sheet expansion again broke above 2,000 and set new highs.
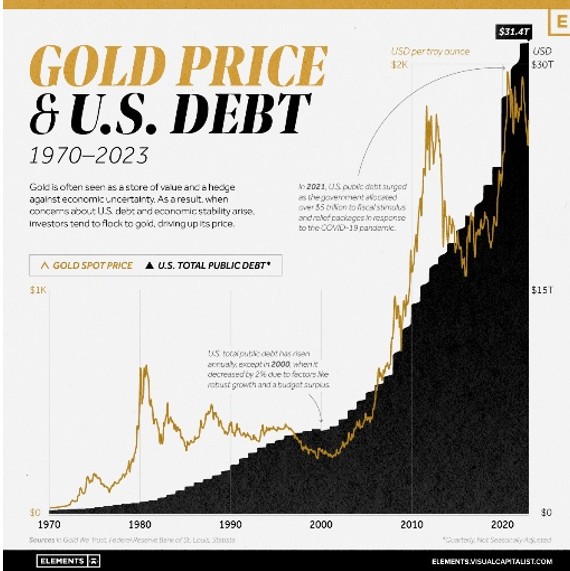
Source: Visual Capitalist
The cost is also obvious: those without assets mainly felt rising consumer prices and housing costs; those with assets first experienced a round of mark‑to‑market gains, then absorbed valuation pullbacks in the following rate‑hike cycle; the wealth gap between the two widened further.
When inflation truly broke out in 2021–2022, the Fed was forced into the fastest rate‑hiking cycle in decades; stocks and bonds fell together, and the last path of propping up confidence mainly through asset prices temporarily came to an end.
If we roughly compare these three historical stages, we see a faintly consistent pattern:
In every round, the side that really pays is the side holding nominal claims on some issuer—deposits, Treasuries, fixed income. In every round, the side that benefits relatively is the side holding things independent of a specific issuer’s credit—real assets, equity in companies with strong pricing power, or gold.
This is not a conspiracy theory. It is a structural feature that will naturally appear in any feasible path chosen by a government with monetary sovereignty facing massive debt.
This round: when Warsh sits in that chair
Everything above is the three acts already played. Right now, the sovereign balance sheet is writing the fourth.
By 2025, the total debt of the US federal government was already about 120 percent of its own GDP, and annual federal interest expenses were close to the 1‑trillion‑dollar range. That single line item is enough to stand alongside defense and other major budget categories, which means that even without adding any new programs, just keeping this debt tower from collapsing has already become a heavy and rigid budget burden.
Against this backdrop, Donald Trump has nominated Kevin Warsh as the next Fed chair, with markets expecting him to formally take over around mid‑2026.
Warsh’s public image is somewhat complex. Around the 2008 financial crisis he was known within the Fed for his caution toward QE and ultra‑low rates, seen as a relatively hawkish voice, and he repeatedly warned that prolonged zero rates would distort asset prices and sow future risks. But around the time of this nomination, his public remarks have also emphasized that he is not an unconditional hard‑liner: when the economy slows significantly, he can support moderate rate cuts, and at the same time he hopes to shrink the balance sheet and restore rate flexibility to leave room for future policy.
He wants to defend anti‑inflation credibility, but he cannot completely ignore the pressure from the White House and markets not to drag down growth. The space between these forces is very narrow. Whoever sits in that chair will be looking at the same cluster of contradictions: on one side, high debt and heavy interest‑expense pressure; on the other, demands for low and stable inflation and relatively stable asset prices; plus a layer of political pressure that can change direction at any time.
Within the framework of the three previous methods, viewed this way, after Warsh takes over the US is most likely to take a middle path:
Debt will continue to climb slowly from an already high level. Inflation will probably not run out of control, but it will also be hard to keep it very low for long. Real rates will likely stay roughly positive, but not high enough to help the government quickly and easily eat away its debt stock.
In such a world, it will be hard to return to the long period of deep negative real rates and sustained financial repression after World War II, and equally hard to restart the unlimited QE model after 2008, and there will be little political room to repeat Volcker‑style 20‑percent interest rates.
The most likely outcome is that the debt will be slowly boiled away: over time, through moderate inflation and modest growth. Long‑term nominal claims will likely fail to preserve full purchasing power, but will probably not be wiped out overnight by a single violent inflation shock.
For ordinary people, compressing this complicated story into one sentence yields this: do not bet your life entirely on the side that only collects interest; lean a bit more toward the side that owns real assets and pricing power.
In a high‑debt, moderate‑inflation world where real rates are not very low, many people, when making long‑term plans, can think—based on their own risk tolerance, cash‑flow situation, and goals—about how to balance across different assets:
On one hand, you do not have to keep a very high share of your wealth locked in fixed‑rate assets with very long duration (such as long‑dated Treasuries or fixed‑income products), so that when rates and the environment change later, you are not left with too little room to adjust.
On the other hand, provided that you fully understand the risks and can accept price volatility, you can pay more attention to high‑quality equity and other productive assets with sustainable profitability and some pricing power in an inflationary environment, and keep a small share allocated to gold and a bit of foreign currency that have relatively low correlation with traditional assets, to diversify overall risk.
For daily spending and short‑term cash‑flow planning, you can reserve some cash and short‑duration bonds to secure liquidity and avoid being forced to sell long‑term assets at the wrong time.
The overall idea stops here. You still need to make choices based on your own circumstances and slowly polish a portfolio that suits you.
The content of this article is only for investor education and reflection and does not constitute any investment advice. The historical data mentioned come from public academic research and official reports, and past performance does not represent future results.


 Is Part Of A 2 Billion AI Debt Wave Shaking Credit Markets")
