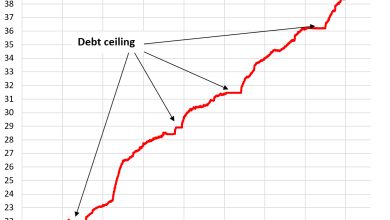
Chartbook 469: The risk of unwind
The interest rate set by bond markets around the world, are going up. As tens of trillions of dollars of fixed-interest debt trade at lower prices, yields rise. The market where this matters most is the gigantic market for US Treasuries. At the same time, in the summer of 2026, the discussion of China shock 2.0 focuses our attention on the huge trade surplus of China and the huge deficit of the US. We are still, in other words, in a world of “twin” US “deficits”: both on the government budget and on current account. But that world is very differently structured than it once was. And the risks of financial havoc induced by private financial actors are far greater.
Whereas once those two deficits were directly linked by their financing mechanisms – trade surpluses with the US accumulated by exporters like China were reinvested by official reserve managers in US Treasury bonds (so-called “Bretton Woods 2.0” recycling), the relationship is no longer so straight forward.
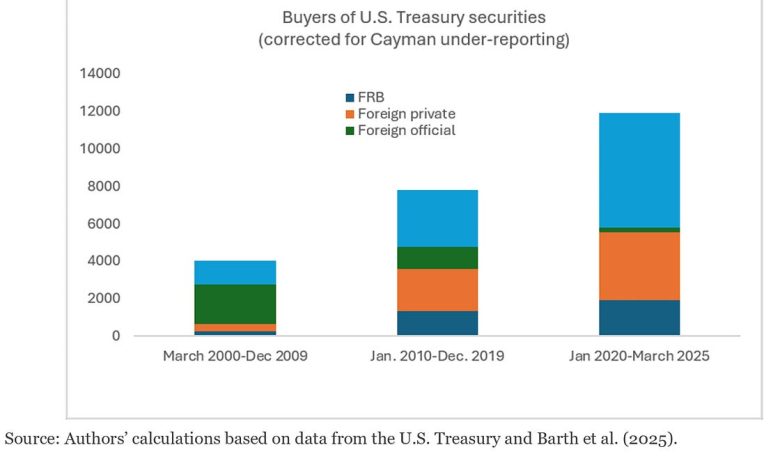
This is brought out by the latest paper by Anusha Chari and Gian Maria Milesi-Ferretti of Brookings. As they show, in the classic era of reserve accumulation under Bretton Woods 2.0, between 2000 and 2009, a very large share of net US Treasury issuance was acquired by foreign official reserve holdings – the “twin deficits” model in action.
Since the 2008-2009 crisis, the twin deficits model has gradually been replaced by a new regime.
In the 2010s, as post-crisis deficits piled up and US Treasury issuance continued at a rapid pace, some foreign official reserve accumulation continued. But it was now increasingly foreign private investors who took over the absorption of new debt, along with domestic private investors (the data are adjusted to allow for the offshoring of US private holding to the Cayman islands).
Since 2020 with unprecedented deficits and debt issuance, the kind of official reserve accumulation typical of the 2000s has come almost entirely to a halt and it is US and foreign private investors who have absorbed the new issuance of Treasuries.
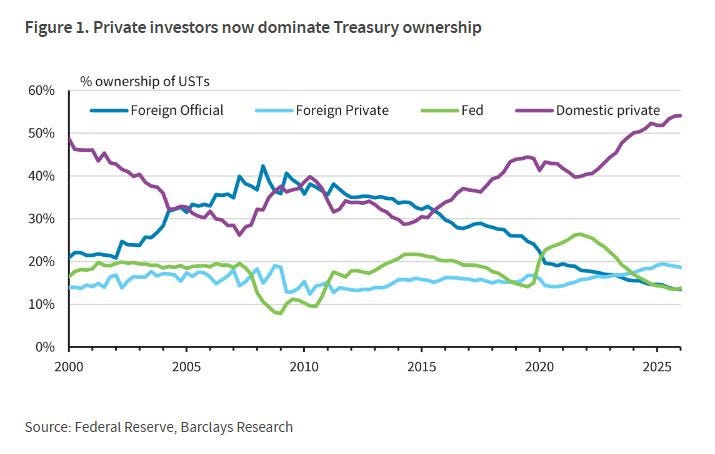
Tracy Alloway tells the same story with a graph showing shares of Treasury ownership. The dark turquoise line (for official foreign reserves) peaks around 2008-2009 at over 40 percent and then declines. The ligher blue line for foreign private holdings overtakes official foreign holdings. And the dominant buyers are now domestic private investors.
Though China continues to run huge trade surpluses with the US and it continues to manipulate its exchange rate, this no longer manifests in large-scale official purchases of US Treasury debt. So who are the foreign investors who still buy dollar assets and thus finance US trade deficits? What attracts them? And what attracts both foreign and US private investors into Treasury debt? The simple answer is that it is no longer the imperative of foreign exchange manipulation or export-orientated industrial policy that is driving funds into the Treasury market, but the pursuit of profit.
For investors worldwide US financial markets with their promise of outsized returns have proven irresistibly attractive. Equity markets are one key element of this. As Chari et al’s data show, America’s bilateral financial liabilities especially towards the Euro Area, the Anglosphere and advanced Asia consist in large part of portfolio equity investments and FDI. By contrast, portfolio debt (i.e. Treasury positions accumulated in the 2000s) dominates bilateral liabilities towards China. Since the 2010s, China has been converting its huge claims on the world economy into claims on debtors other than the US.
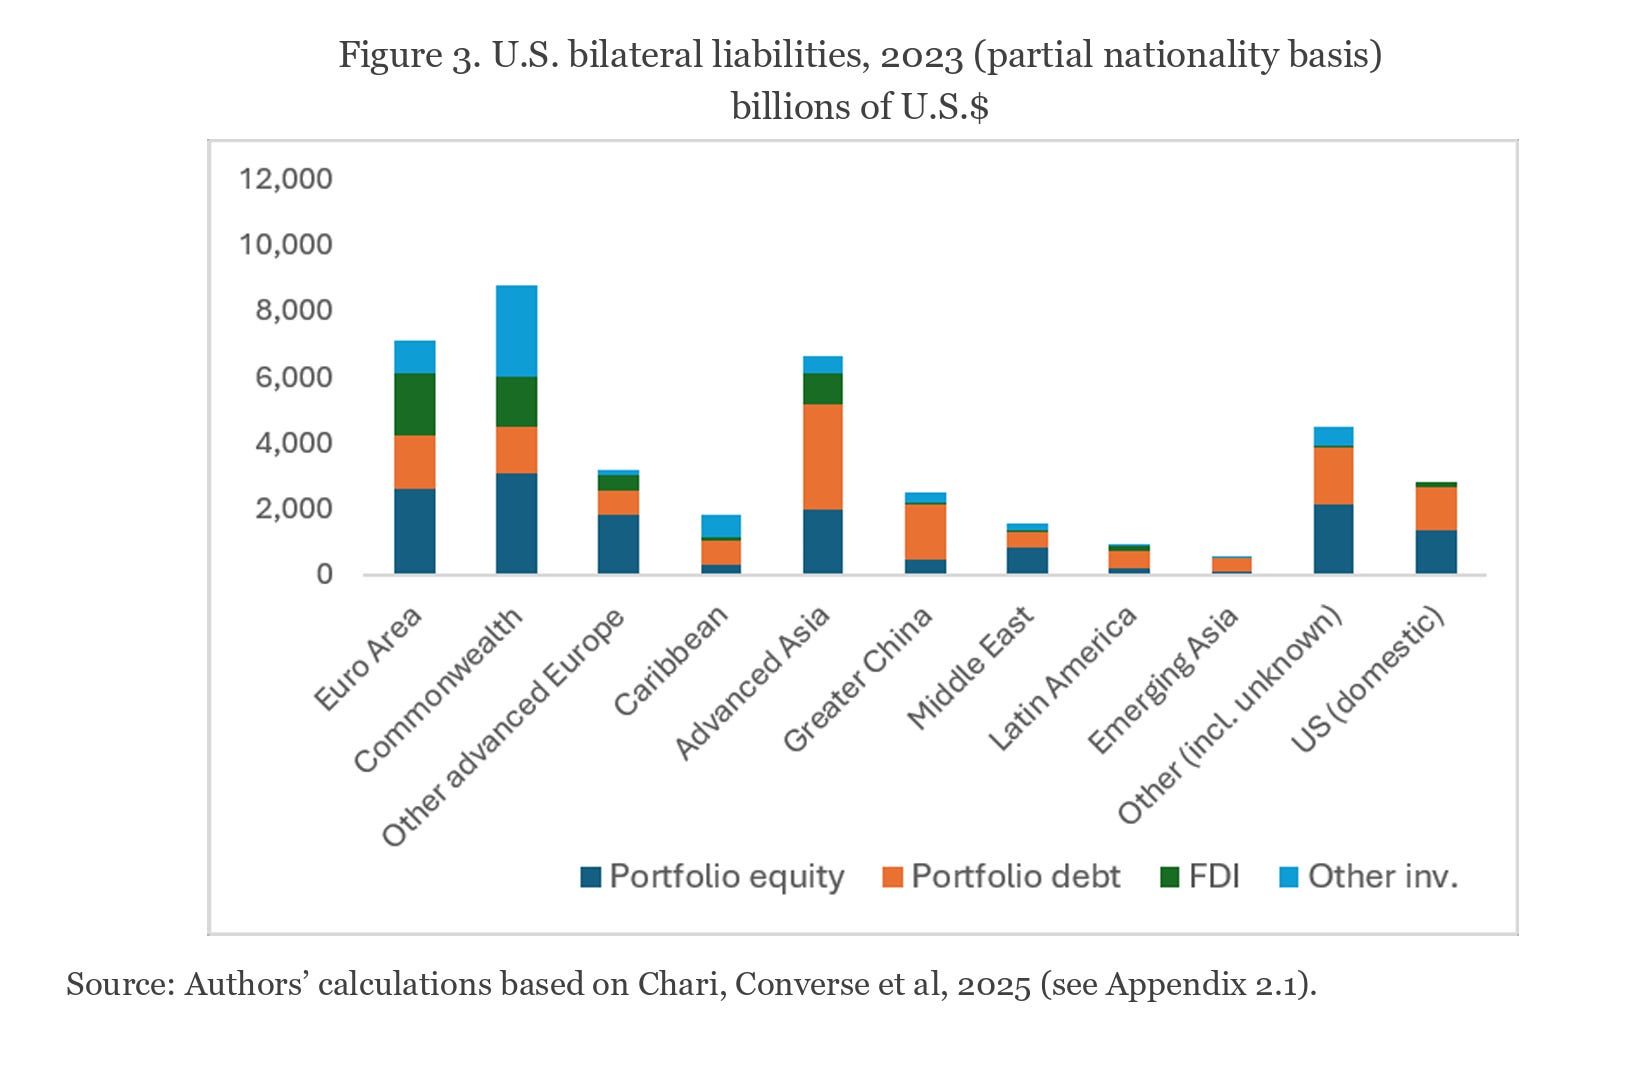
But US Treasuries too attract interest, above all for the financial operations that such a liquid asset permit. Since the 2010s amongst foreign owners it is above all major global financial centers – the euro-area, the UK- that have increased their share of US Treasury holdings … and the Cayman islands.
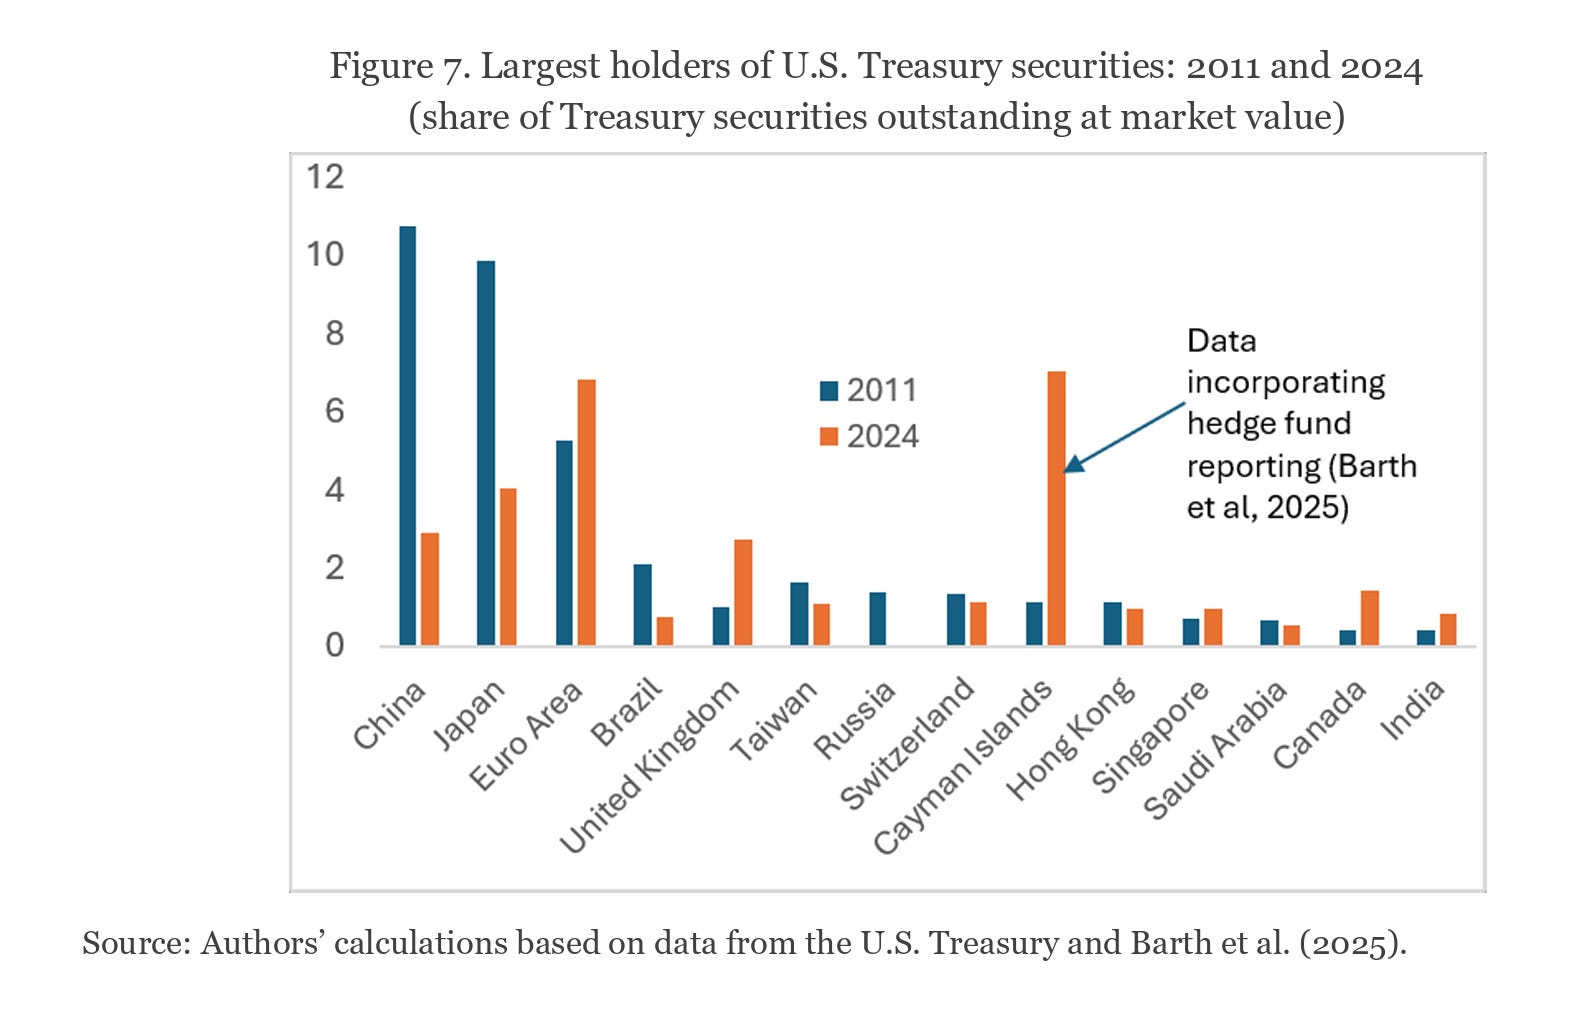
The Cayman islands matter because they are the offshore home for a significant cluster of hedge funds. And since the 2010s it is hedge funds who have provided a key source of demand for US government debt.
This accumulation first began in the late 2010s as the Fed began to pull back from quantitative easing (i.e. Treasury purchases). Hedge fund Treasury holdings crested in early 2020 just ahead of COVID. This worked as long as it worked. But it also brought with it a major new source of instability. Hedge funds are hugely sensitive to rates of return and they operate with leverage. If the going get rough they are forced to exit. This became painfully evident in the spring of 2020. As the turbulence of the pandemic hit, the funds offloaded hundreds of billions of Treasuries, causing panic in the market in March 2020 – the crisis discussed in the last Chartbook newsletter.
A recent research paper by Phillip J. Monin of the New York Fed shows, the size of the hedge fund investment in Treasuries
Figure 1. Treasury Exposures, Repo Exposures, and Turnover
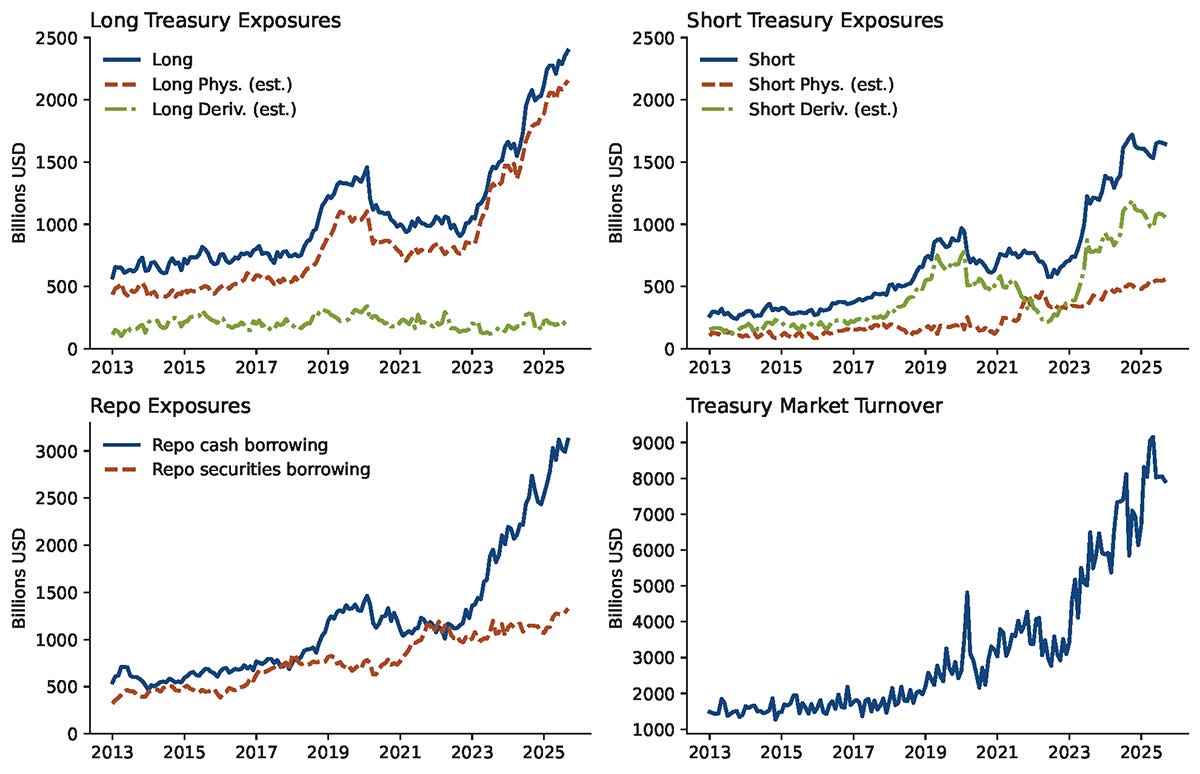
Note: Data are monthly through September 2025. Physical and derivatives exposures estimated as in Banegas et al. (2021). Treasury market turnover includes cash securities and Treasury-linked derivatives. Sources: SEC Form PF, author’s analysis.
Through 2023 hedge fund activity was subdued. But then, with a significant tightening of Fed policy, hedge fund purchases of US Treasuries surged. Their share of the overall Treasury market doubled, even as the volume of Treasuries increased by trillions of dollars. As the NY Fed research found: “Hedge funds’ Treasury securities holdings now exceed those of mutual funds and U.S.-chartered depository institutions.”
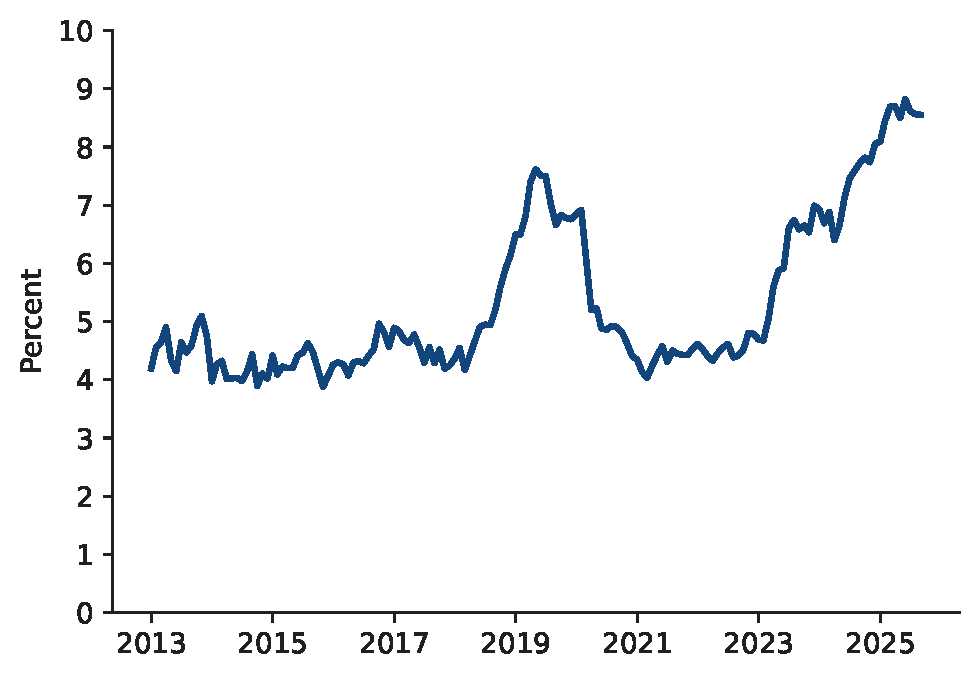
Hedge fund demand, as was already demonstrated in 2020, can be extremely volatile, overstretching the capacity of even the deepest and most liquid market to absorb sales. So this accumulation of exposure is worrying. And it is all the more so, since it is clear that this accumulation of Treasury exposure is financed not through a huge accumulation of new funds by the hedge funds themselves, but by borrowing. According to recent research by the OFR “Hedge funds primarily rely upon repurchase agreements and prime brokerage borrowing. In 2025, hedge fund repurchase agreement borrowing grew by 154% and prime brokerage borrowing by 83% since 2022.”
Figure 4. Hedge Fund Borrowing ($ billions)
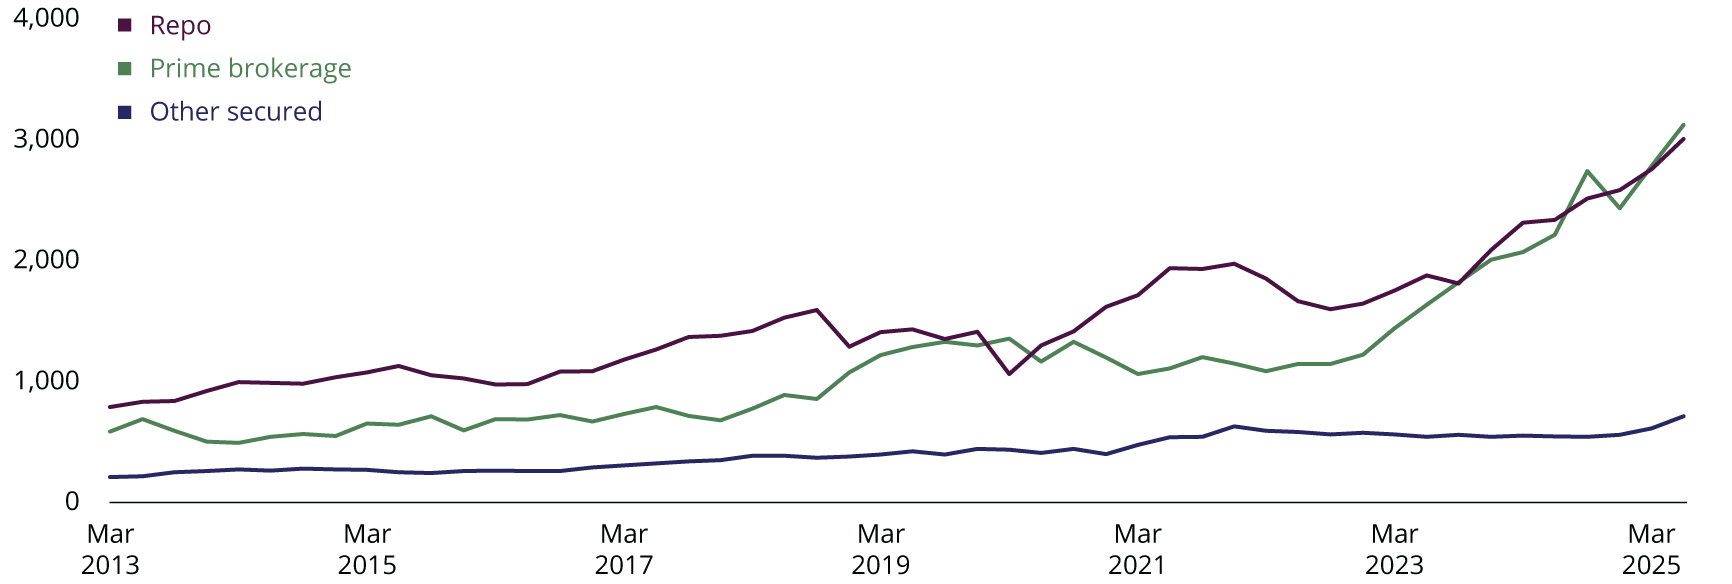
Note: Data as of June 2025. Data reflect only QHFs.
Sources: OFR Hedge Fund Monitor, Office of Financial Research.
As the New York Fed research identified:
The scale of this expansion is striking: since the beginning of 2023, hedge funds’ gross Treasury exposures, repo borrowing levels, and monthly turnover in Treasury markets have all more than doubled. Moreover, their Treasury activities have become increasingly concentrated, with the 50 largest funds by gross Treasury exposures accounting for approximately 90 percent of the total, up from 84 percent at the beginning of 2023.
Decomposing different types of trades put in place by the hedge funds, the New York Fed found that
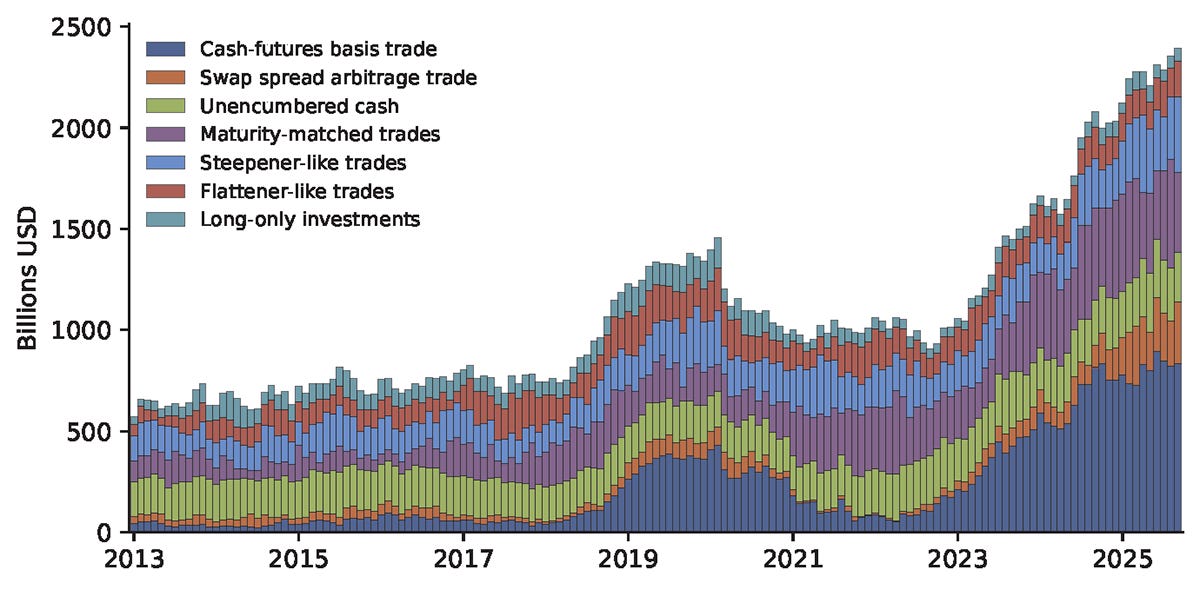
highly leveraged arbitrage strategies (basis trade and swap spread arbitrage) account for nearly half of the $2.4 trillion in long positions as of September 2025, while the remaining exposure is distributed across yield curve trades, unencumbered cash holdings, and long-only investment uses.
Figure 3. Hedge Funds’ Estimated Uses for Long Treasury Exposure
In short, if as I argued in the last Chartbook post, the shock of March 2020 continues to hang over the market. There is very good reason to be worried.
In the 2020 crisis it was above all the unwinding of highly leveraged basis trade positions that did the damage to the Treasury market. According to the New York Fed, that risk is far worse today than it was at the time of the COVID outbreak:
Figure 4. Hedge Funds’ Estimated Basis Trade Positions
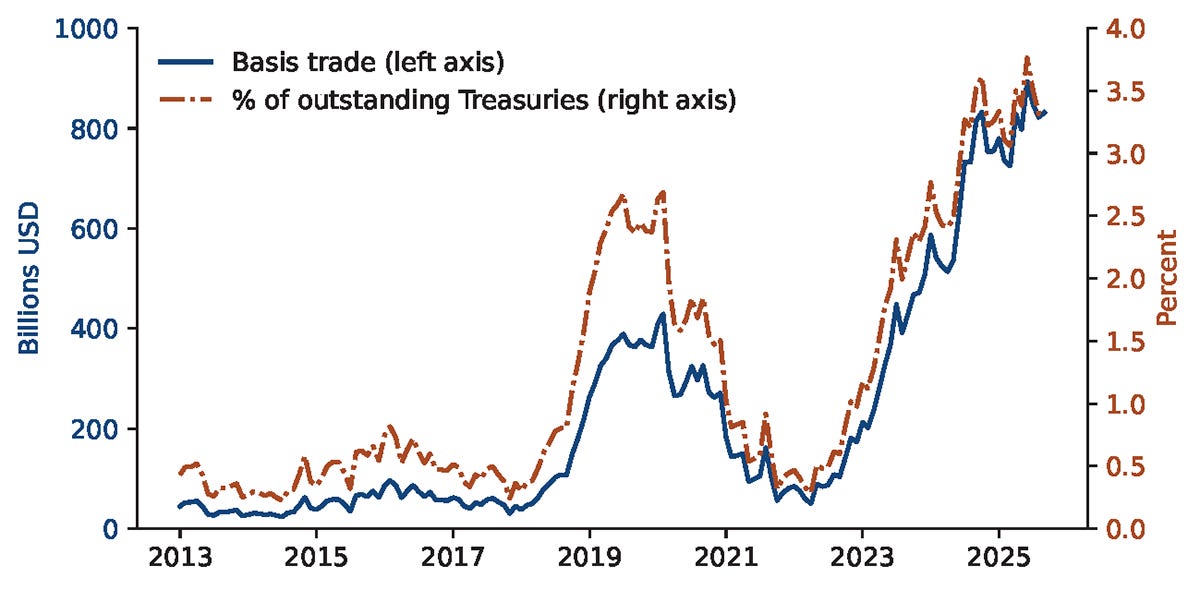
“We estimate that aggregate basis trade volumes reached approximately $830 billion in September 2025, close to doubling their peak from early 2020.6 Hedge fund positions in the basis trade recently accounted for a historically high 3.5 percent of total outstanding privately held Treasury securities by market value, a 40 percent increase from the previous peak of 2.5 percent in early 2020.”
I love putting out Chartbook. I am particularly pleased that it goes out for free to thousands of subscribers around the world. But, writing this newsletter takes a lot of work. If you are enjoying it and would like to support the project, sign up for one of the subscription options here. It is the equivalent of a fancy cup of coffee per month!