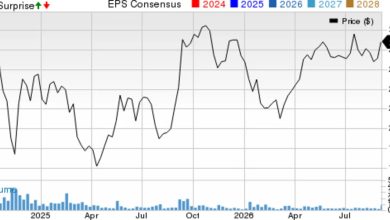
Crane has delivered a strong 5 year share price return of 282.7%, yet today its valuation picture is mixed, with the Discounted Cash Flow (DCF) intrinsic value estimate pointing to a roughly fair price while earnings based checks suggest the stock is not cheap.
A 282.7% gain over 5 years puts Crane among the stronger performers in its peer group, which can leave less room for error if expectations are high.
Expectations for ongoing cash flow generation may support the current price, but any disappointment in margins or cost control could weigh on what investors are prepared to pay.
Crane passes 0 of 6 valuation checks, so the broader assessment on metrics like P/E and P/B leans expensive rather than a clear bargain, as shown in its low value score here.
The issue now is whether Crane’s current share price already reflects its intrinsic value, or if the recent run still leaves room for a reasonable margin of safety.
The Discounted Cash Flow (DCF) model values Crane by projecting future free cash flows and discounting them back to today. For Crane, the latest twelve month free cash flow sits at about $362.1 million, and the model assumes these cash flows continue growing over time rather than shrinking or remaining flat.
On these assumptions, the DCF model points to an intrinsic value of roughly $198.94 per share, which works out to the stock trading about 9.3% above that estimate. Because the Cintas earnings update focuses attention on costs and margins across related industrial services, the premium to Crane’s cash flow value may look less comfortable if investors become more cautious about profitability.
Overall, the Discounted Cash Flow assessment suggests Crane currently looks about fairly valued, with only a modest premium to its estimated intrinsic worth.
Crane is fairly valued according to our Discounted Cash Flow (DCF), but this can change at a moment’s notice. Track the value in your watchlist or portfolio and be alerted on when to act.
The P/E ratio is a useful cross check for Crane because earnings are a key focus for industrial companies, where investors watch profitability closely. Crane currently trades on a P/E of about 39.2x, compared with an average of roughly 27.2x for the wider Machinery industry and a peer group average near 28.2x. This already signals a clear premium.
The tailored fair P/E ratio for Crane is estimated at about 28.3x, so the current multiple stands well above what this framework implies would be reasonable given its profile. That gap suggests investors are paying more for each dollar of Crane earnings relative to both peers and the modelled fair level, leaving the stock exposed if sentiment or earnings expectations cool.
On the P/E multiple alone, Crane stock appears expensive compared with both its fair ratio and sector benchmarks.
The Crane Narrative: What Would Justify Today’s Price?
Simply Wall St Narratives for Crane pick up where this valuation puzzle leaves off. They spell out which paths for Crane’s growth, margins and earnings would need to play out for the stock to be worth materially more or less than today’s price, and they sit on the company’s Community page. Each narrative links its number to a clear view on how Crane’s growth, profitability and risks could evolve, giving you something specific to revisit as fresh information appears.
The community is split on Crane, with one camp focusing on an 11% undervalued story and the other highlighting a 13% overvalued risk.
Bull case: 11% undervalued
“The company’s ongoing investment in R&D and advanced sensing, paired with a capital deployment plan focused on high-return internal projects and M&A in core segments, positions Crane to outgrow its markets and compound earnings per share through both organic innovation and disciplined acquisitions…”
“Rapid advances in industrial automation and digitization increasingly favor technology-led manufacturers, while Crane’s legacy manufacturing roots and limited exposure to high-growth adjacencies leave it vulnerable to being edged out from the most lucrative and recurring smart-industry projects, resulting in long-term loss of market share and diminished earnings potential…”
For Crane, the Discounted Cash Flow (DCF) intrinsic value estimate suggests the stock now sits close to fair value, with only a modest premium to that model. Market multiples, however, indicate Crane screens as overvalued, which is consistent with its weak broader valuation checks. That tension leaves the debate hinging on whether earnings and margins stay strong enough to justify paying a higher P/E than peers. The crux from here is whether future profitability supports today’s richer multiple or whether the market eventually asks for a lower price for the same earnings.
This article by Simply Wall St is general in nature. We provide commentary based on historical data and analyst forecasts only using an unbiased methodology and our articles are not intended to be financial advice. It does not constitute a recommendation to buy or sell any stock, and does not take account of your objectives, or your financial situation. We aim to bring you long-term focused analysis driven by fundamental data. Note that our analysis may not factor in the latest price-sensitive company announcements or qualitative material. Simply Wall St has no position in any stocks mentioned.