Tech Stocks Surge as Momentum Traps the Bears – July 21, 2026

Key Takeaways
- High-beta momentum stocks recently suffered a 33% drawdown.
- Fear levels remain elevated among investors.
- Failed bearish technical patterns suggest that the pain is over for tech bulls.
Tuesday, Wall Street investors sent the market soaring as they looked past geopolitical concerns and jockeyed for positioning in tech stocks ahead of earnings season. The Nasdaq, which has been the most beaten-down index, stormed back nearly 2%.
Time to Buy the Dip in Momentum Stocks?
High beta, tech momentum just suffered a 33% drawdown in a handful of sessions, marking one of the worst drawdowns since the late 1990s Dot Com bubble burst. However, previous drawdowns of this magnitude have resulted in significant market bottoms. For instance, in 2022, high-beta momentum stocks suffered a 32.82% drawdown before bouncing.
Image Source: GS
Stocks Climb the Wall of Worry
According to the CNN Fear & Greed Index, Wall Street investors are currently fearful. The fear comes as the major market indices have chopped sideways over the past few weeks. Despite the flattish price action, the destruction of momentum stocks and the restarting of the U.S.-Iran conflict have caused elevated fear levels

Image Source: CNN
However, just as many investors threw in the towel on AI stocks, recently beaten-down AI stocks such as SanDisk ((SNDK – Free Report) ), Cerebras Systems ((CBRS – Free Report) ), Cipher Mining ((CIFR – Free Report) ) stormed back.
From False Moves Come Fast Moves
On Wall Street, one day does not prove a trend. Nevertheless, it can produce valuable clues for investors. For instance, Micron ((MU – Free Report) ), a leading AI stock, broke down from a bearish head-and-shoulders pattern on the daily chart. However, on Tuesday, shares roared back more than 10% and retook the “neckline” of the pattern. More often than not, false moves produce violent moves in the opposite direction as late bears and shorts get trapped.
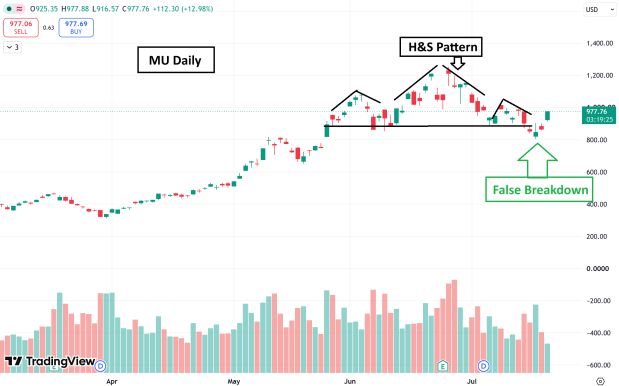
Image Source: TradingView
Meanwhile, MU shares retook the 10-week moving average after a brief shake below it. The regain of the 10-week moving average means that shares remain in an uptrend. Furthermore, MU is forming a classic bull flag pattern. Similar patterns have produced triple-digit returns over the past few years.

Image Source: TradingView
Bottom Line
Tuesday, stocks climbed the proverbial Wall of Worry as investors looked beyond geopolitical concerns. The false moves in many AI stocks suggest that the rally has staying power.