Iran Reopens Strait of Hormuz, Oil Prices Plunge Amid Strengthened Expectations of Fed Rate Cuts

On Friday (April 17), gold surged strongly, driven by expectations of an agreement between the US and Iran; Iran’s reopening of the Strait of Hormuz caused oil prices to plummet, easing inflationary pressures, further reinforcing market expectations of a Federal Reserve rate cut. Spot gold traded near $4,863, with intraday gains of nearly 1.67%, and is on track for a fourth consecutive weekly gain.
Expectations of reconciliation between the US and Iran are rising.
Iranian Foreign Minister Abbas Araghchi said on Friday that the Strait of Hormuz was fully open to all commercial vessels during the ceasefire, in line with the ceasefire agreement with Lebanon.
 Following this news, crude oil prices plunged sharply, with West Texas Intermediate (WTI) falling to its lowest level since March 11. As of writing, WTI crude was trading near $81.50, with intraday losses of nearly 9%.
US President Trump also signaled progress in diplomatic talks with Iran on Thursday: “The likelihood of us reaching an agreement with Iran is very high, and it will be a good agreement.” He told reporters at the White House, adding that the next round of negotiations might take place this weekend; if both sides approach an agreement, he would consider extending the current ceasefire period.
Despite some easing of tensions, gold remains range-bound overall. Expectations of an agreement have boosted market risk appetite, driving global stock markets higher and limiting inflows into gold. Meanwhile, a softer dollar has supported spot gold, curbing its downside.
The US Dollar Index (DXY) traded near 97.98, hitting a more-than-one-month low and is poised for a third consecutive weekly decline.
Oil prices cool, expectations of Federal Reserve rate cuts return.
Meanwhile, as the conflict with Iran appears to be nearing an end, oil prices have retreated, and geopolitical risk premiums have eased, prompting markets to reassess the path of Federal Reserve monetary policy.
This has alleviated market concerns about inflation and reignited expectations of a Federal Reserve rate cut within the year. Lower interest rates typically benefit non-interest-bearing assets like gold.
Looking ahead, traders will closely monitor the progress of US-Iran negotiations this weekend, particularly developments related to the full reopening of the Strait of Hormuz. Trump stated that the US maritime blockade of Iran will remain fully in effect until a final agreement is completely reached.
According to Reuters citing Iran’s official Fars News Agency, Iranian officials stated that if the blockade continues, Tehran will consider it a violation of the ceasefire agreement and may close the Strait of Hormuz again.
In terms of data, US economic data is light with no significant releases. Market focus will shift to speeches by Federal Reserve officials as preparation for the blackout period ahead of the FOMC meeting scheduled for April 28-29.
Technical Analysis: Spot gold consolidates, Bollinger Bands narrow, watch for breakout
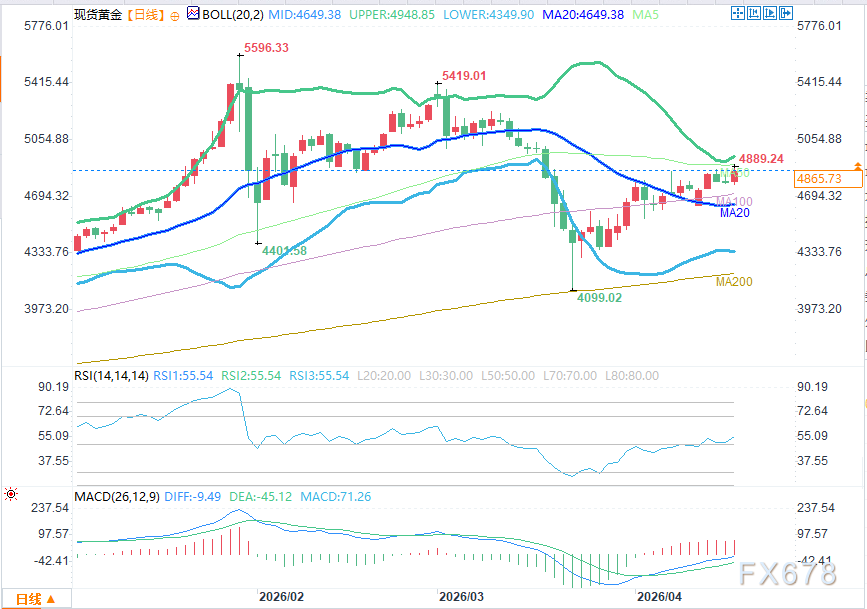
(Spot Gold Daily Chart Source: Easy Forex)
On the daily chart, spot gold is steadily trading above the middle Bollinger Band/20-day Simple Moving Average (SMA) at $4649, while also holding above the 100-day moving average, indicating a short-term bullish bias. The narrowing of the Bollinger Bands suggests declining volatility, signaling that a new trend may be about to begin.
The Relative Strength Index (RSI14) is hovering around 55.4, already above the neutral level of 50, reflecting that bullish momentum has recovered and has not yet entered overbought territory. The previous rebound from oversold levels indicates some easing of downward pressure, while the MACD shows that although the DIFF line remains below the zero axis, it has turned upward, with histogram bars transitioning from green to red, signaling waning bearish momentum and strengthening bullish forces.
Upside resistance: The first resistance level is the confluence of the 50-day moving average and the upper Bollinger Band, approximately $4897-$4948. If bulls push higher, new selling pressure may emerge at this level.
Downside support: The first support level is the middle Bollinger Band/20-day moving average at approximately $4649, while the 100-day moving average at around $4713 has become a key defensive level for pullbacks.


